New Publication: Spatiotemporal Fusion Modelling Using STARFM: Examples of Landsat 8 and Sentinel-2 NDVI in Bavaria
We are glad to share with you our newest publication on “Spatiotemporal Fusion Modelling Using...
Read More
We are glad to share with you our newest publication on “Spatiotemporal Fusion Modelling Using...
Read More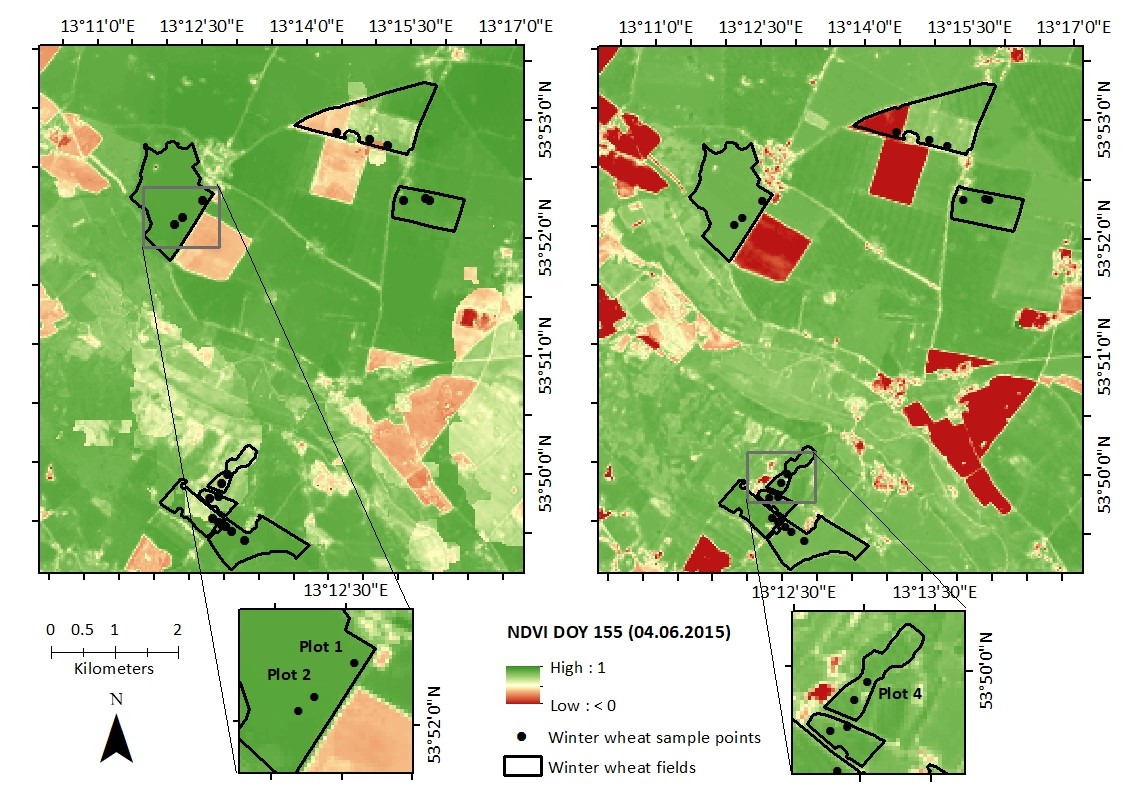
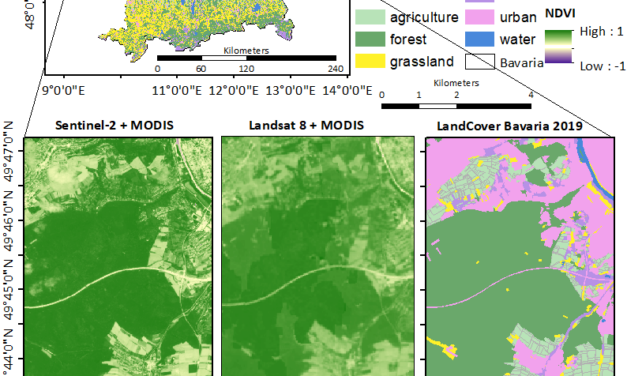
Figure 1. Image-wise comparison of normalized difference vegetation index (NDVI) obtained from...
Read More
Easy spatio-temporal visualization of 15 selected efficient wheat yield producing countries using...
Read More
The below animation shows a spatiotemporal pattern of winter wheat ‘s biomass growth in...
Read More
For winter wheat crop modelling, I designed some animations in R. To make growth curves and bubble...
Read More