Here we see three simple ways to perform an unsupervised classification on a raster dataset in R. I will show these approaches, but first we need to load the relevant packages and the actual data. You could use the Landsat data used in the “Remote Sensing and GIS for Ecologists” book which can be downloaded here.
library("raster")
library("cluster")
library("randomForest")
# loading the layerstack
# here we use a subset of the Landsat dataset from "Remote Sensing and GIS for Ecologists"
image <- stack("path/to/raster")
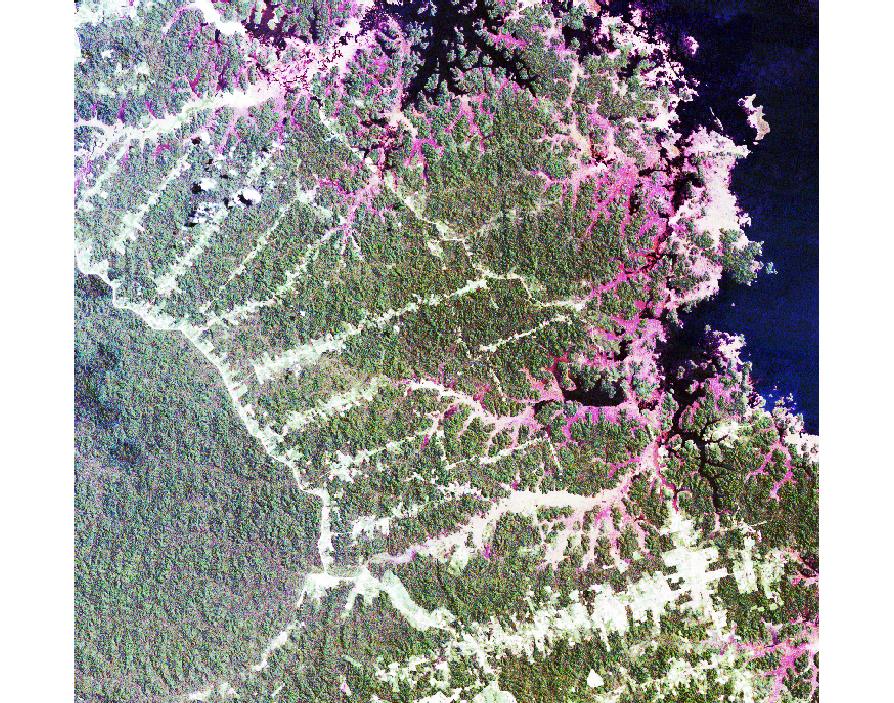
plotRGB(image, r=3,g=2,b=1,stretch="hist")
Now we will prepare the data for the classifications. First we convert the raster data in a matrix, then we remove the NA-values.
## returns the values of the raster dataset and write them in a matrix.
v <- getValues(image)
i <- which(!is.na(v))
v <- na.omit(v)
The first classification method is the well-known k-means method. It separates n observations into k clusters. Each observation belongs to the cluster with the nearest mean.
## kmeans classification
E <- kmeans(v, 12, iter.max = 100, nstart = 10)
kmeans_raster <- raster(image)
kmeans_raster[i] <- E$cluster
plot(kmeans_raster)

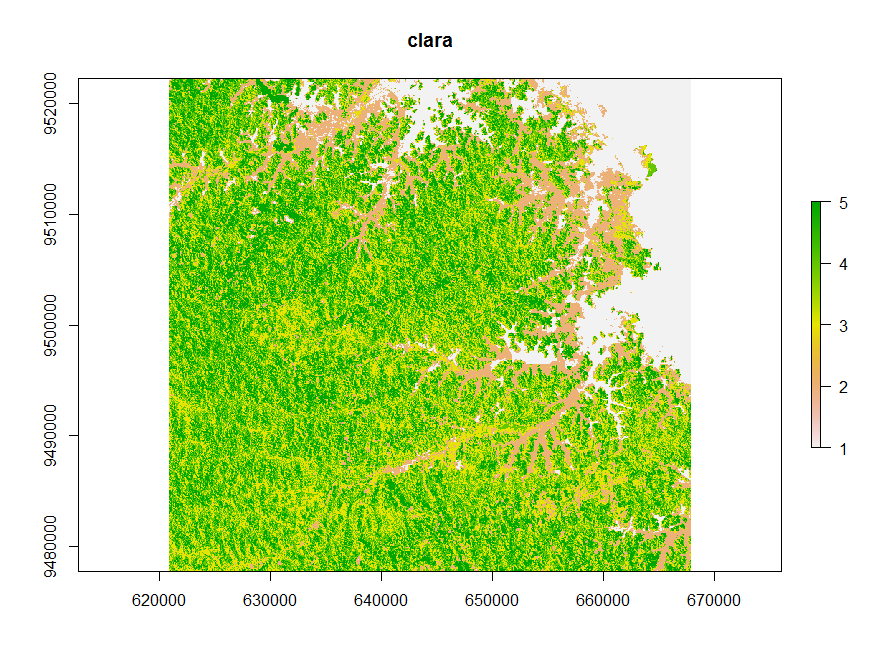
The second classification method is called clara (Clustering for Large Applications). It work by clustering only a sample of the dataset and then assigns all object in the dataset to the clusters.
## clara classification
clus <- clara(v,12,samples=500,metric="manhattan",pamLike=T)
clara_raster <- raster(image)
clara_raster[i] <- clus$clustering
plot(clara_raster)
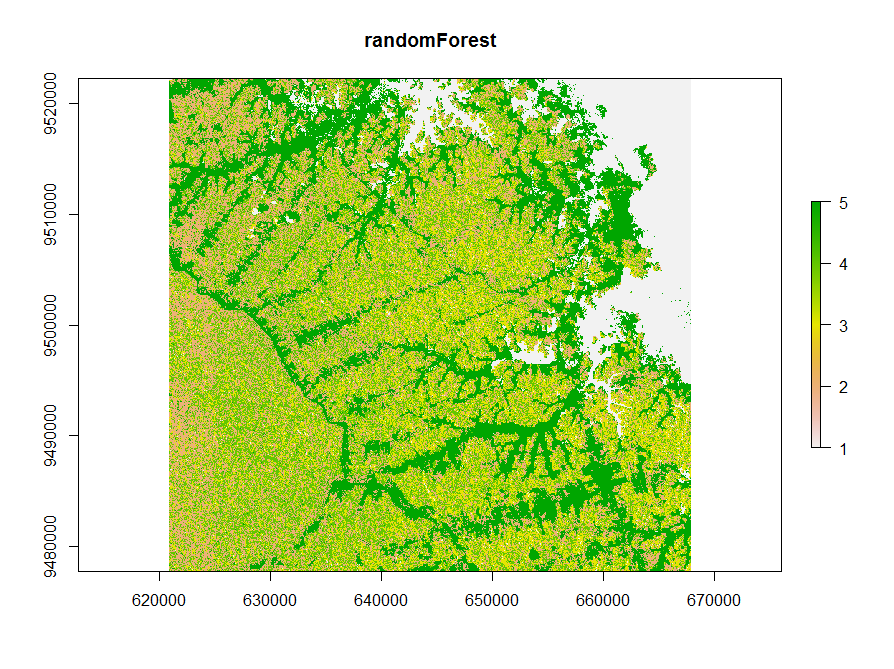
The third method uses a random Forest model to calculate proximity values. These values were clustered using k-means. The clusters are used to train another random Forest model for classification.
## unsupervised randomForest classification using kmeans
vx<-v[sample(nrow(v), 500),]
rf = randomForest(vx)
rf_prox <- randomForest(vx,ntree = 1000, proximity = TRUE)$proximity

E_rf <- kmeans(rf_prox, 12, iter.max = 100, nstart = 10)
rf <- randomForest(vx,as.factor(E_rf$cluster),ntree = 500)
rf_raster<- predict(image,rf)
plot(rf_raster)
The three classifications are stacked into one layerstack and plotted for comparison.
class_stack <- stack(kmeans_raster,clara_raster,rf_raster)
names(class_stack) <- c("kmeans","clara","randomForest")

plot(class_stack)
Comparing the three classifications:
Looking at the different classifications we notice, that the kmeans and clara classifications have only minor differences.
The randomForest classification shows a different image.
want to read more about R and classifications? check out this book: