R Package for harmonic modelling of time-series data

R Package for harmonic modelling of time-series data

April 23, 2020

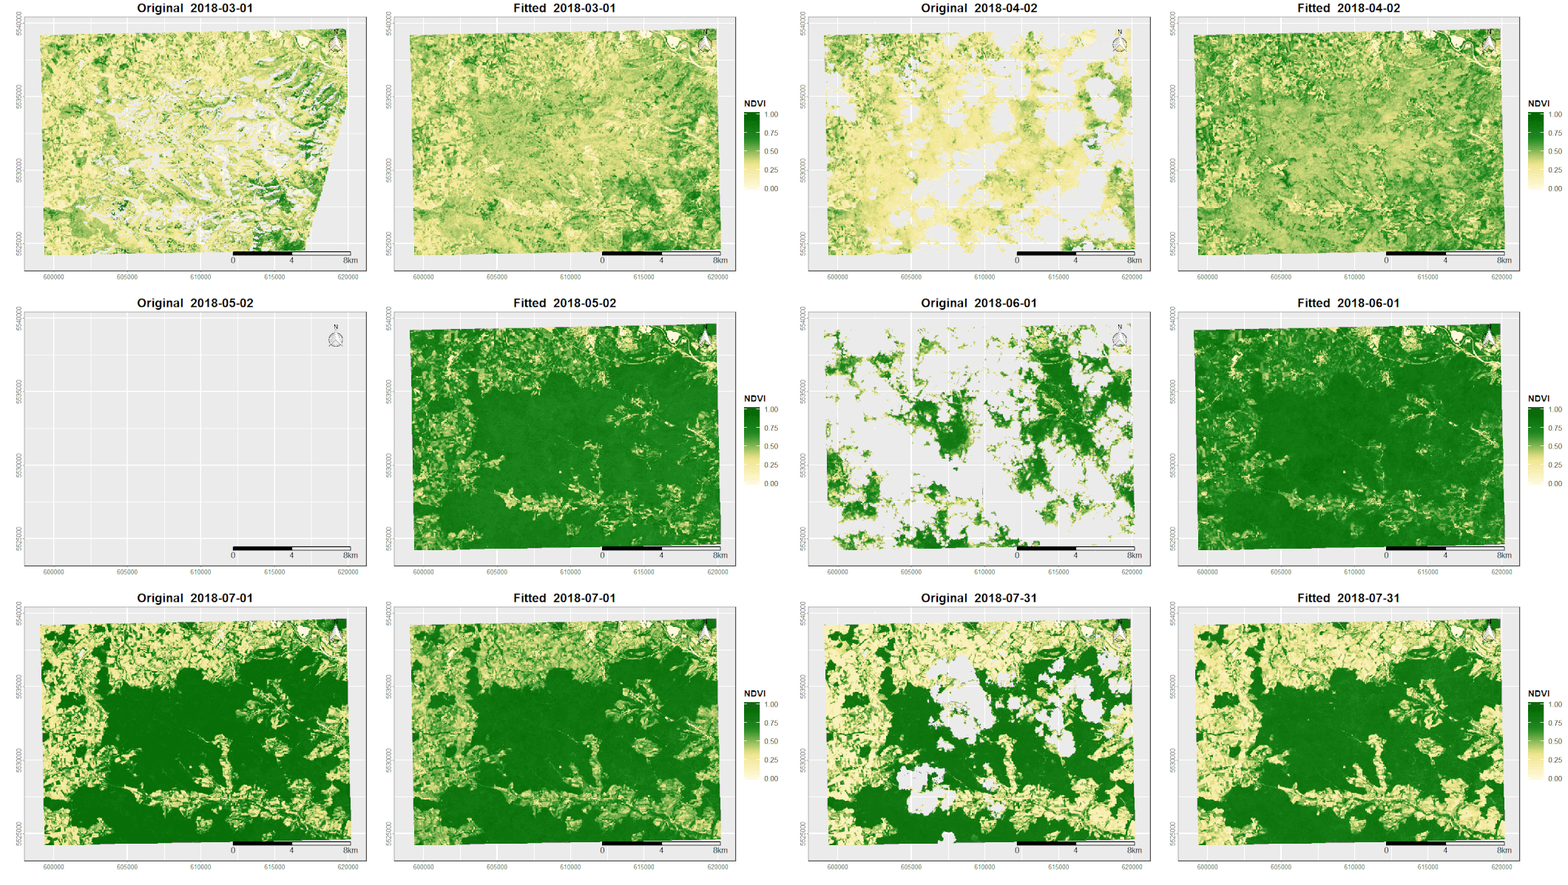
Sentinel-2 NDVI time-series over the Steigerwald. Left: Original satellite scenes after cloud, cloud shadow and snow maksing. Right: Interpolated time-series using a harmonic modelling.

In order to fully exploit the monitoring potential of the satellite systems, challenges such as noise and data gaps must be effectively addressed. These quality losses are mainly caused by sensor artifacts, clouds, cloud shadows and other weather conditions (Verbesselt et al., 2012). In the context of time series analysis, harmonic modeling is a powerful tool to fill these gaps and reduce noise by smoothing the original signal (de Jong et al., 2011).

For that purpose, I created an R-package rHarmonics which enables the user to perform a harmonic analysis on a given time-series data set.

To calculate the harmonic fitted curve of a periodic signal, ordinary least squares regressions are computed using coupled sine and cosine curves on time-series data. The underlying algorithm which is based on Shumway & Stoffer (2017) equations 4.1 – 4.2 can be seen below:

MODIS NDVI time-series data together with a harmonic fitted curve using 3 cylces per year.


Literature:

de Jong, R., de Bruin, S., de Wit, A., Schaepman, M. E., & Dent, D. L. (2011). Analysis of monotonic greening and browning trends from global ndvi time-series. Remote Sensing of Environment, 115 (2), 692–702.

Shumway, R. H., & Stoffer, D. S. (2017). Time series analysis and its applications: with r examples. Springer.

Verbesselt, J., Zeileis, A., & Herold, M. (2012). Near real-time disturbance detection using satellite image time series. Remote Sensing of Environment, 123 , 98–108.

you may also like:

EORC and EAGLE summer BBQ

EORC and EAGLE summer BBQ

We’re happy to announce that our summer BBQ is happening again on Thursday, July 24th at 4 pm! Alongside good food and a relaxed atmosphere, we’re also hosting a series of short talks highlighting exciting topics in Earth Observation and environmental science: “The...

🗺 Exploring Map Visualizations

🗺 Exploring Map Visualizations

Within our EAGLE courses our students have to learn a wide variety of skills - beside the fundamental earth observation theory and practice also skills like map creation is part of the curriculum. One of our students Ronja Seitz has created three visualizations guides...

Successful Completion of UNIversInternational Certificate

Successful Completion of UNIversInternational Certificate

In line with its internationalization strategy, the University of Würzburg supports administrative staff in their task of advising and supporting international students, guests, and academics. To this end, it has launched the "UNIversInternational" certificate...

The “Geolingual Studies” team visited the DLR EOC

The “Geolingual Studies” team visited the DLR EOC

The "Geolingual Studies" team of the University Würzburg visited the DLR-EOC on 3 and 4 July 2025. Geolingual Studies is an innovative area of research and teaching which takes a decisively applied linguistic approach and combines methodologies from linguistics,...