We recently reported on the urban heat island effect in Germany and the work of DLR and EORC on the topic – please see here: https://remote-sensing.org/understanding-urban-heat-in-germany-insights-from-prof-hannes-taubenbocks-research/
Here is a link to the original press release: https://www.dlr.de/de/aktuelles/nachrichten/2025/dlr-zeigt-hohe-hitzebelastung-in-deutschen-grossstaedten?utm_source=chatgpt.com
During the recent heatwave in Germany, the topic was picked up by many media and our work was reported on or discussed in social media. Here is a selection of the reporting.
- Frankfurter Allgemeine Zeitung (FAZ): https://www.faz.net/aktuell/wissen/erde-klima/heisse-temperaturen-was-und-wie-gefaehrlich-sind-hitzewellen-110640643.html
- Frankfurter Rundschau: https://www.fr.de/wissen/stadtklima-wenig-gruen-viel-hitze-93892944.html
- ntv: https://www.n-tv.de/mediathek/videos/panorama/Satellitenbilder-deutscher-Staedte-zeigen-Hitzezentren-article25964146.html
- Deutsches Komitee Katastrophenvorsorge e.V.: https://dkkv.org/dlr-zeigt-hohe-hitzebelastung-in-deutschen-grossstaedten/
- Verband Deutscher Vermessungsingenieure VDV: https://www.vdv-online.de/aktuelles/vdvaktuell/dlr-zeigt-hohe-hitzebelastung-in-deutschen-grossstaedten.html
Examples of further links are here:
- https://www.reddit.com/r/de/comments/1msnaw2/satellitendaten_dlr_weist_hohe_hitzebelastung_in/
- https://www.heise.de/news/Satellitendaten-DLR-weist-hohe-Hitzebelastung-in-deutschen-Grossstaedten-nach-10538728.html
- https://www.baulinks.de/webplugin/2025/1126.php4
- https://www.goettinger-tageblatt.de/lokales/goettingen-lk/goettingen/hitze-in-goettingen-wo-es-im-sommer-besonders-heiss-ist-und-wo-besonders-kuehl-OKRCVTNYDNBS3BNS6OCQUMSTTU.html
- https://www.msn.com/de-de/gesundheit/other/dlr-oberpfaffenhofen-zeigt-hitze-hot-spots-in-gro%C3%9Fst%C3%A4dten-gefahr-f%C3%BCr-die-gesundheit-steigt/ar-AA1KuVlZ
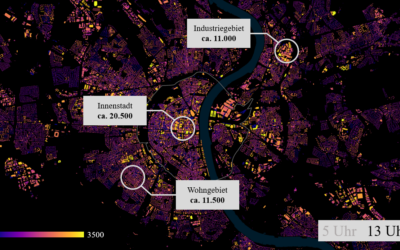
The image shown here as teaser is of the city of Würzburg. It shows mean values of surface temperatures at midday in the summer months of June, July and August in the years 2013 to 2024. The figure shows how the surface temperatures differ in the built-up and non-built-up areas. Surface temperature and air temperature do not correspond 1:1, but they are directly related and the spatial patterns are similar. Heat islands can therefore be identified on the basis of the surface temperature. For all visual results from all large cities in Germany, please see here: https://www.flickr.com/photos/dlr_de/albums/72177720328336287/