Article published: Modelling Crop Biomass from Synthetic Remote Sensing Time Series: Example for the DEMMIN Test Site, Germany

Article published: Modelling Crop Biomass from Synthetic Remote Sensing Time Series: Example for the DEMMIN Test Site, Germany

June 5, 2020

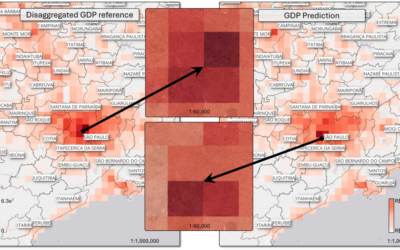
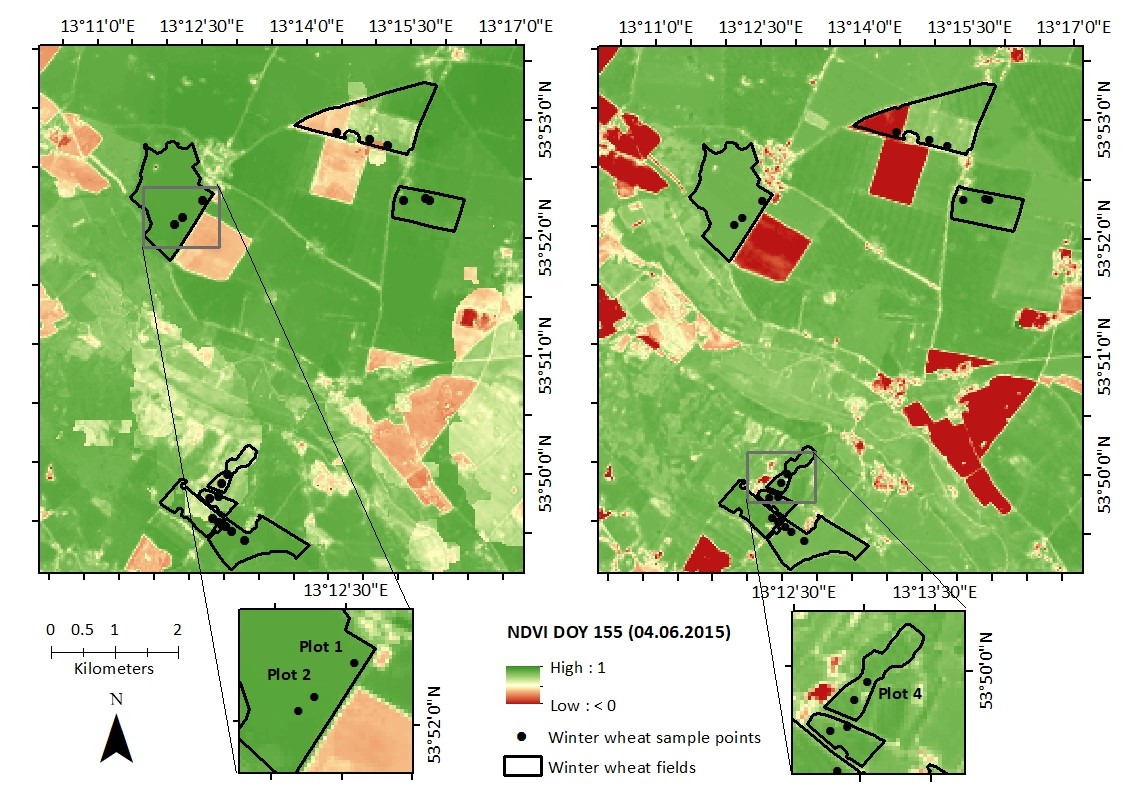
Figure 1. Image-wise comparison of normalized difference vegetation index (NDVI) obtained from Landsat and the spatial and temporal reflectance adaptive reflectance fusion model (STARFM) of a 30-meter spatial resolution on DOY 155 (4 June); (left) NDVI image obtained from Landsat 8 (right) NDVI image obtained from the STARFM. Two subset maps at the bottom show a detailed spatial comparison of Plot 1, Plot 2, and Plot 4 on one of the winter wheat fields of the study region. The legend at the bottom center of the images shows the NDVI range from high: 1 (green) to low: <0 (red).

The article entitled “Modelling Crop Biomass from Synthetic Remote Sensing Time Series: Example for the DEMMIN Test Site, Germany” is published in the remote sensing journal of MDPI. This open-access article is published as a feature paper in a special issue named “Multi-Sensor Data Fusion and Analysis of Multi-Temporal Remote Sensed Imagery”.

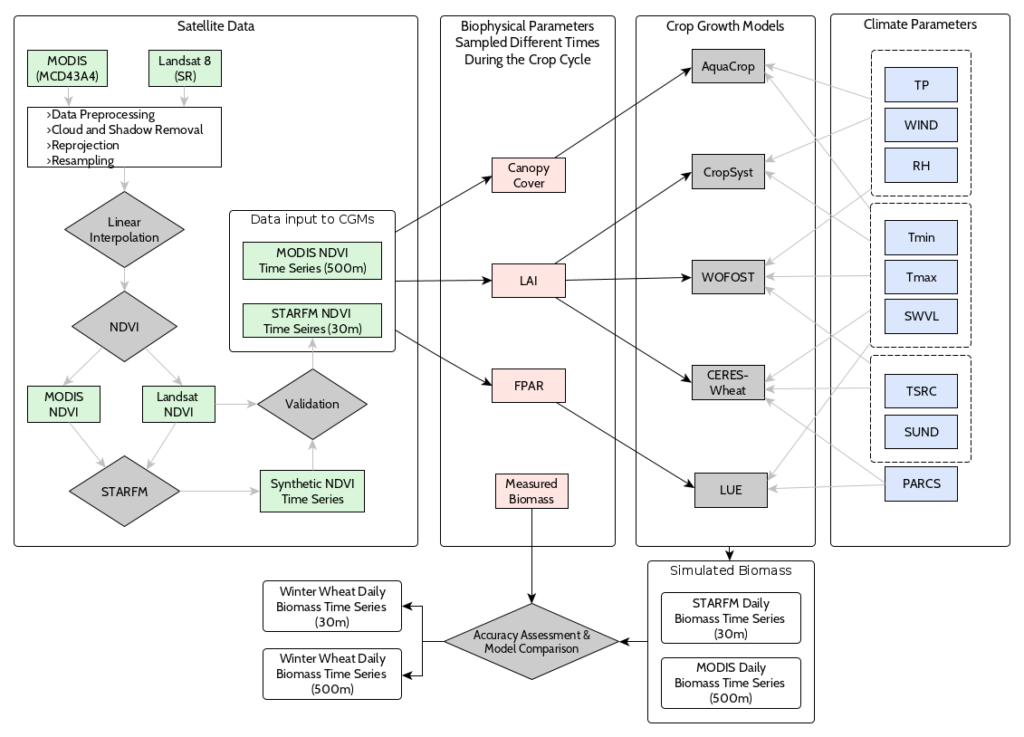
This study compares the performance of the five widely used crop growth models (CGMs): World Food Studies (WOFOST), Coalition for Environmentally Responsible Economies (CERES)-Wheat, AquaCrop, cropping systems simulation model (CropSyst), and the semi-empiric light use efficiency approach (LUE) for the prediction of winter wheat biomass on the Durable Environmental Multidisciplinary Monitoring Information Network (DEMMIN) test site, Germany. The study focuses on the use of remote sensing (RS) data, acquired in 2015, in CGMs, as they offer spatial information on the actual conditions of the vegetation. Along with this, the study investigates the data fusion of Landsat (30 m) and Moderate Resolution Imaging Spectroradiometer (MODIS) (500 m) data using the spatial and temporal reflectance adaptive reflectance fusion model (STARFM) fusion algorithm.

Figure 2. Conceptual framework of the study that states the total input requirement of the crop growth models (CGMs), including various climate parameters, and biophysical parameters derived from the STARFM and MODIS NDVI time series. The simulated biomass obtained from the CGMs is validated with the in situ biomass and CGMs are compared on the basis of simplicity, accuracy, and reliability using the STARFM and MODIS data sets. The end products are obtained as a winter wheat daily biomass time series of 30 m and 500 m spatial resolutions during the study period.
Figure 3. Comparison of two best-fit models: AquaCrop (left) and LUE (right) based on the spatial distribution of their simulated biomass obtained on DOY 171 using the STARFM NDVI input for winter wheat during the study period. The stretched legend at bottom left represents the maximum and minimum range of crop biomass from 1554.81 to 1212.3 g/m2. Two subset maps at the bottom of each image show the detailed spatial distribution of biomass for five sample plots distributed in two winter wheat fields of the study region.

The article is co-authored by the colleagues of the Department of Remote Sensing, University of Wuerzburg (Maninder Singh Dhillon, Thorsten Dahms, Carina Kuebert-Flock), DLR Neustrelitz (Erik Borg), Department of Geoecology and Physical Geography, Martin-Luther-University Halle-Wittenberg (Christopher Conrad), and the Department of Physical Geography, University of Wuerzburg (Tobias Ullmann).

Reference:

Dhillon, M.S.; Dahms, T.; Kuebert-Flock, C.; Borg, E.; Conrad, C.; Ullmann, T. Modelling Crop Biomass from Synthetic Remote Sensing Time Series: Example for the DEMMIN Test Site, Germany. Remote Sens. 202012, 1819.

follow us and share it on:

you may also like:

New publication on Invisible Diversity in Forests

New publication on Invisible Diversity in Forests

We are excited to share our latest collaborative publication with our colleagues from the biological sciences lead by Lena Carlson, now published in Landscape Ecology. This interdisciplinary effort highlights how combining ecological expertise with advanced...

EAGLE M.Sc. Students doing Arctic Internship

EAGLE M.Sc. Students doing Arctic Internship

This spring, Marlene and Aoibhin, two students from our EAGLE M.Sc. program have started their research internship in the high Arctic on Svalbard. Hosted by Prof. Larissa Beumer at the University Centre in Svalbard (UNIS), the students are gaining hands-on experience...

EORC at the Smart Forest Conference: Research meets Practive

EORC at the Smart Forest Conference: Research meets Practive

This week, our EO4CAM staff Sonja and Julian attended the Smart Forest Conference in Freising, a meeting that brings together researchers, forestry practitioners, and technology developers working at the interface of forest science and digital innovation. Over two...

EO4CAM Data Portal Launched to Support Climate Adaptation in Bavaria

EO4CAM Data Portal Launched to Support Climate Adaptation in Bavaria

New Earth observation platform provides satellite-based information for public authorities and planners A new Earth observation data portal is bringing satellite-derived environmental information closer to climate adaptation planning. On 9 March 2026, the EO4CAM data...

Demography Meets Spatial Analysis: Insights from today’s EORC Talk

Demography Meets Spatial Analysis: Insights from today’s EORC Talk

A recent EORC Talk at the Earth Observation Research Cluster (EORC) at the University of Würzburg brought together perspectives from demography, geography, and spatial analysis. Sebastian Klüsener and Tamilwai Kolowa from the Federal Institute for Population Research...

A Fresh Look of the Foyer and Seminarroom for our Events

A Fresh Look of the Foyer and Seminarroom for our Events

Over the past weeks, our foyer and seminar rooms have received a thoughtful upgrade that reflects both the spirit and the scope of our research community. The spaces now feature large-scale prints that visually showcase the diverse research topics within our group,...

Share This