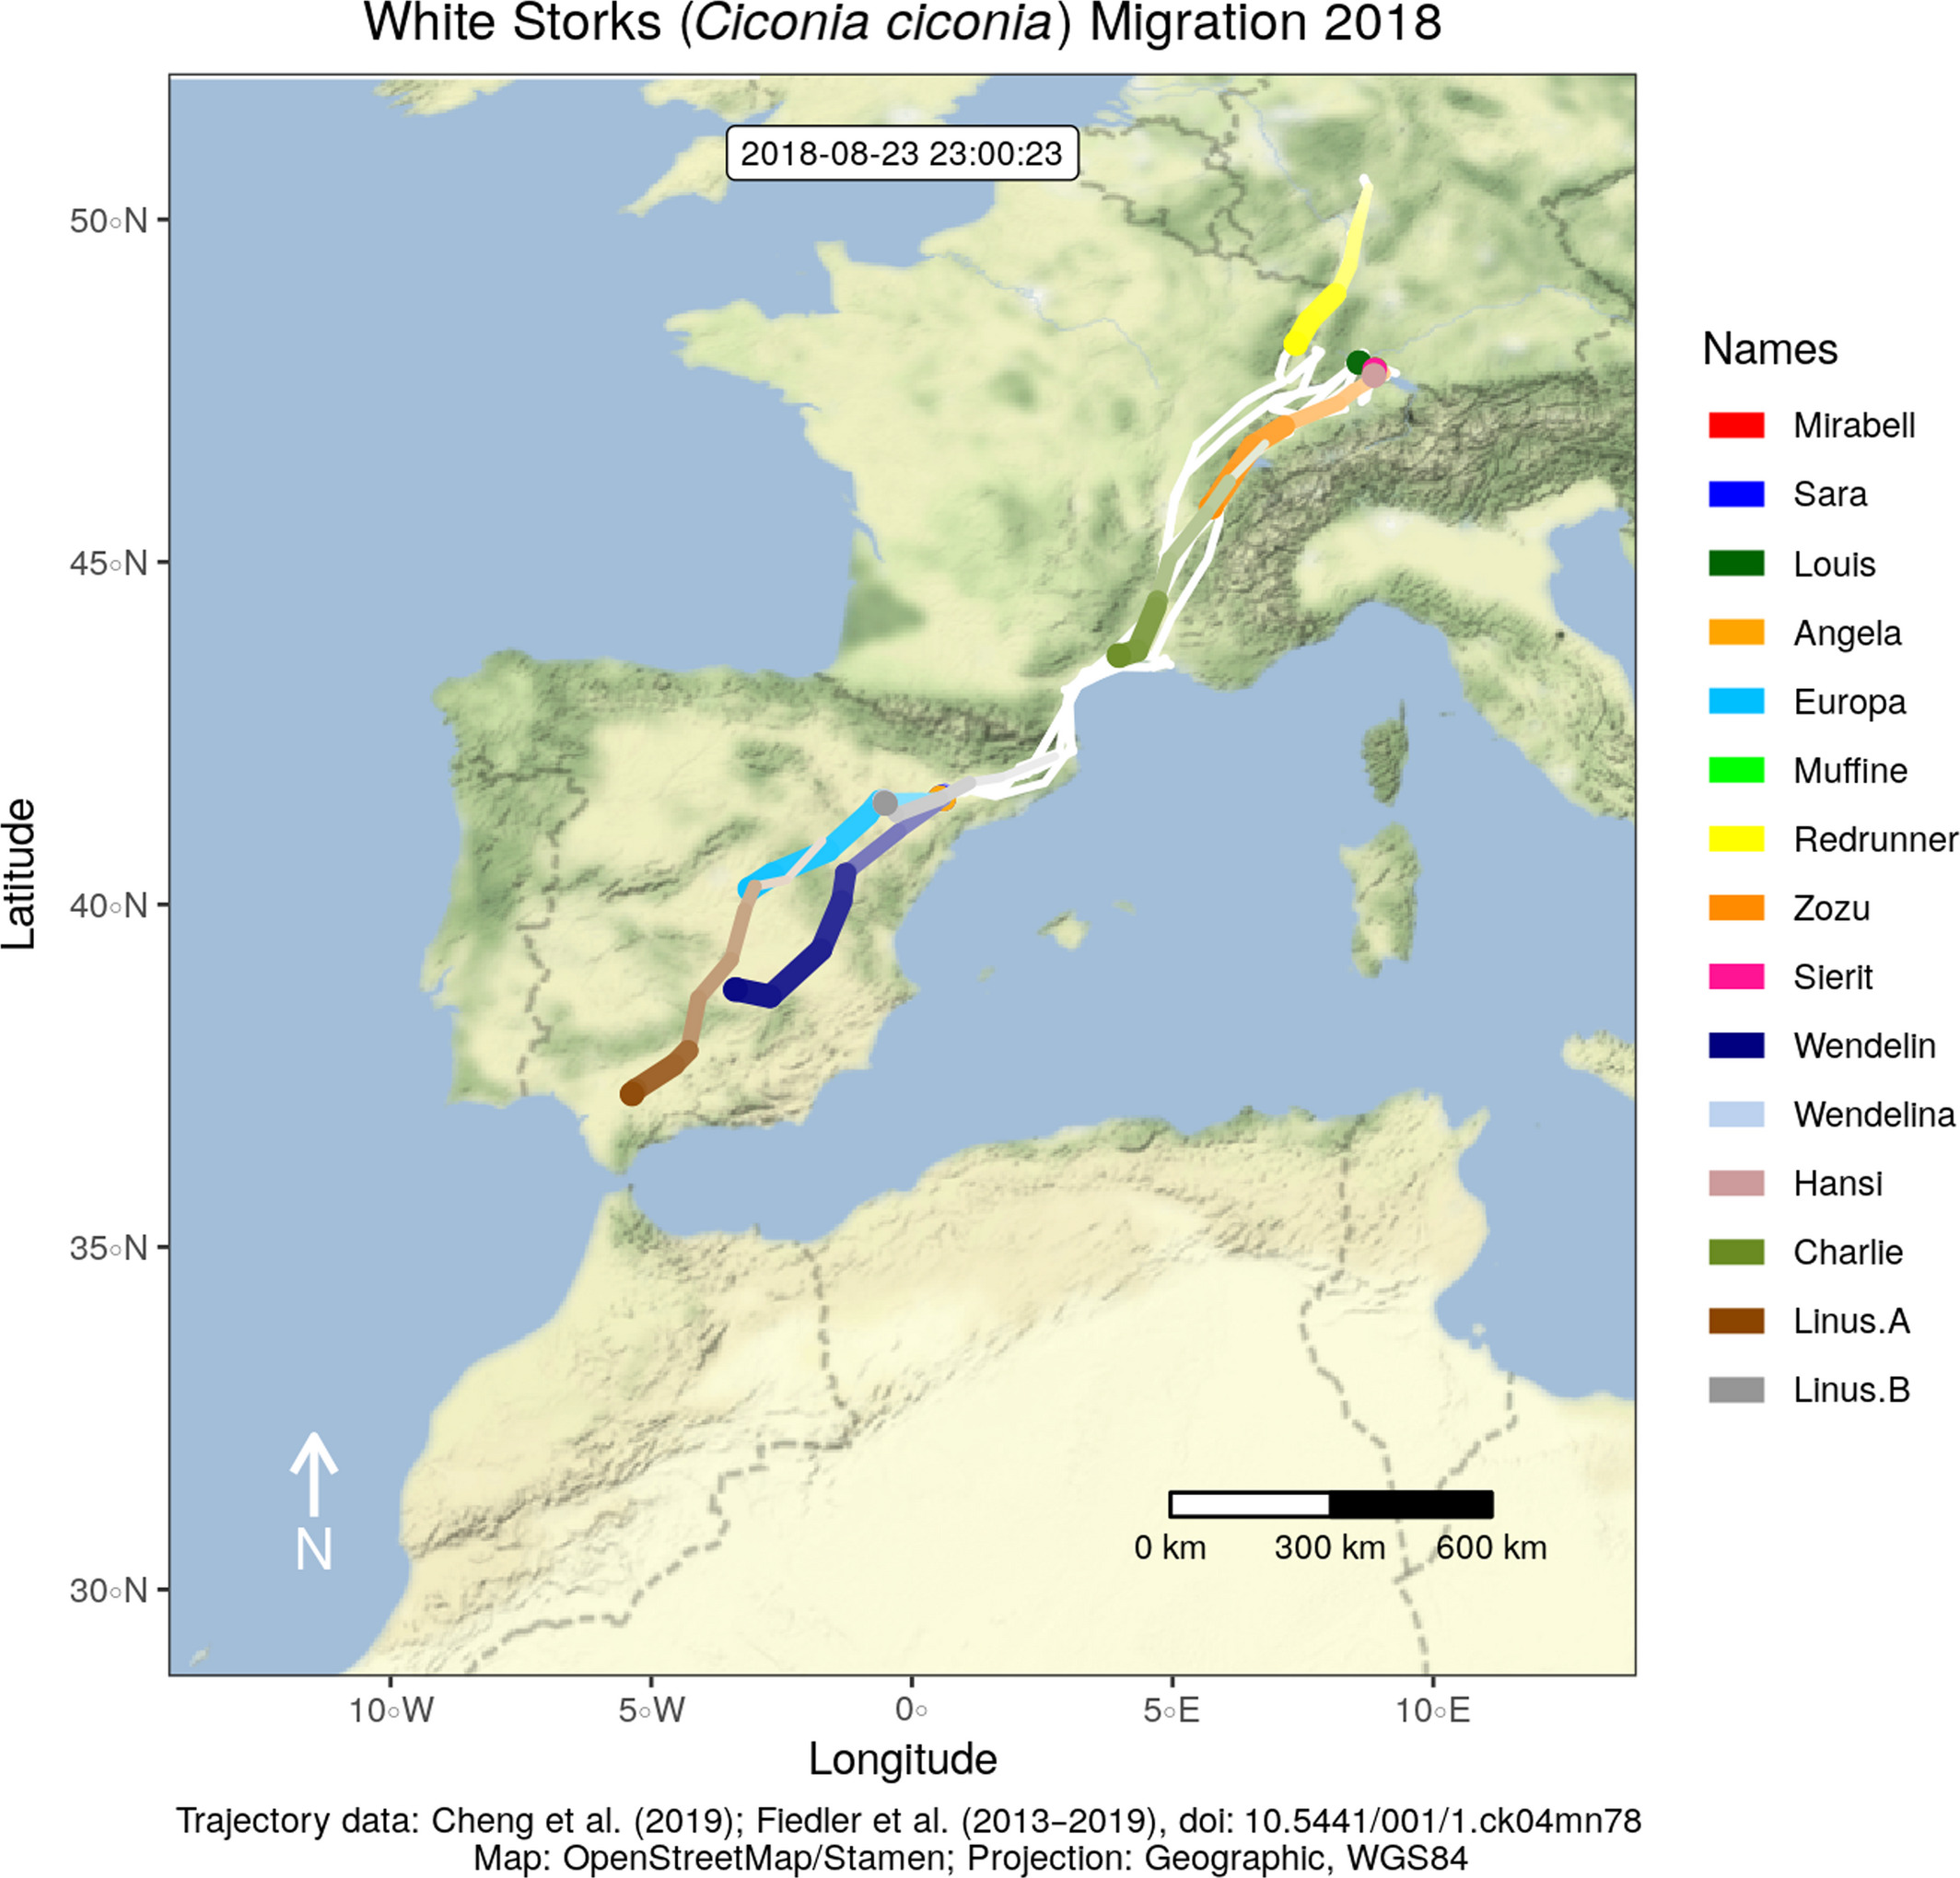
This month, our open-access paper on visualizing movement trajectories in R using moveVis has been published in the latest issue of Methods in Ecology and Evolution. The article describes the moveVis user functions, explains their technical implementation, provides use cases and discusses its strengths and limitations.
The visualization of movement trajectories sometimes is not easy. Spatial data without a temporal component can often be sufficiently visualized using a plot or map of two dimensions, x and y. Movement trajectories, however, are spatio‐temporal data that represent the change in the spatial location of tracked objects or individuals over time. To account for their temporal component, the representation of time in a third dimension is required. While, in certain cases, it can be sufficient to use a static spatial plot to indicate time, e.g. by using a colour palette or by adding a z axis (space-time cubes), a spatio-temporal animation directly relates the temporal dimension of the data to actual time.
To ease the creation of such animations, the R package moveVis has been developed. moveVis automates the processing of movement and environmental data to turn them into an animation. We deem moveVis to be a useful tool for visually exploring and interpreting movement patterns, including potential interactions of individuals with each other and their environment, and communicate such patterns appropriately to different kinds of audiences.
The online version of our open-access paper includes a detailed worked example using migratory movement trajectories of white storks, the resulting video animations (video 1, video 2 & video 3) and an overview of all moveVis functions and their purposes.
To get started using moveVis, we recommend to have a look at our examples and documentation on movevis.org. The source code of moveVis is openly available on GitHub and has been published under GPL-3. If you have ideas on how to improve moveVis (e.g. missing features that could be useful) or if you encounter bugs or have other problems, feel free to open an issue on GitHub for discussion.
This blog post has also been published at AniMove.org.
Reference:
Schwalb-Willmann, J.; Remelgado, R.; Safi, K.; Wegmann, M. (2020). moveVis: Animating movement trajectories in synchronicity with static or temporally dynamic environmental data in R. Methods Ecol Evol. 2020; 11: 664–669. https://doi.org/10.1111/2041-210X.13374

