One of remote sensing’s greatest strengths is its capability to deliver consistent and highly resolved time series. These have a wonderful potential for visualizations and analysis.
Creating a fluid and pretty animation from a collection of tifs can be complicated, as it involves a number of steps:
- Filling gaps in the raster
- Creating consistent spatial plots
- Enhancing and decorating the plots
- Adding ancillary animated charts
Our new R package rtsVis simplifies and assists in all these processing steps. Using just a few functions, you can get from a list of input images to animation-ready ggplots.
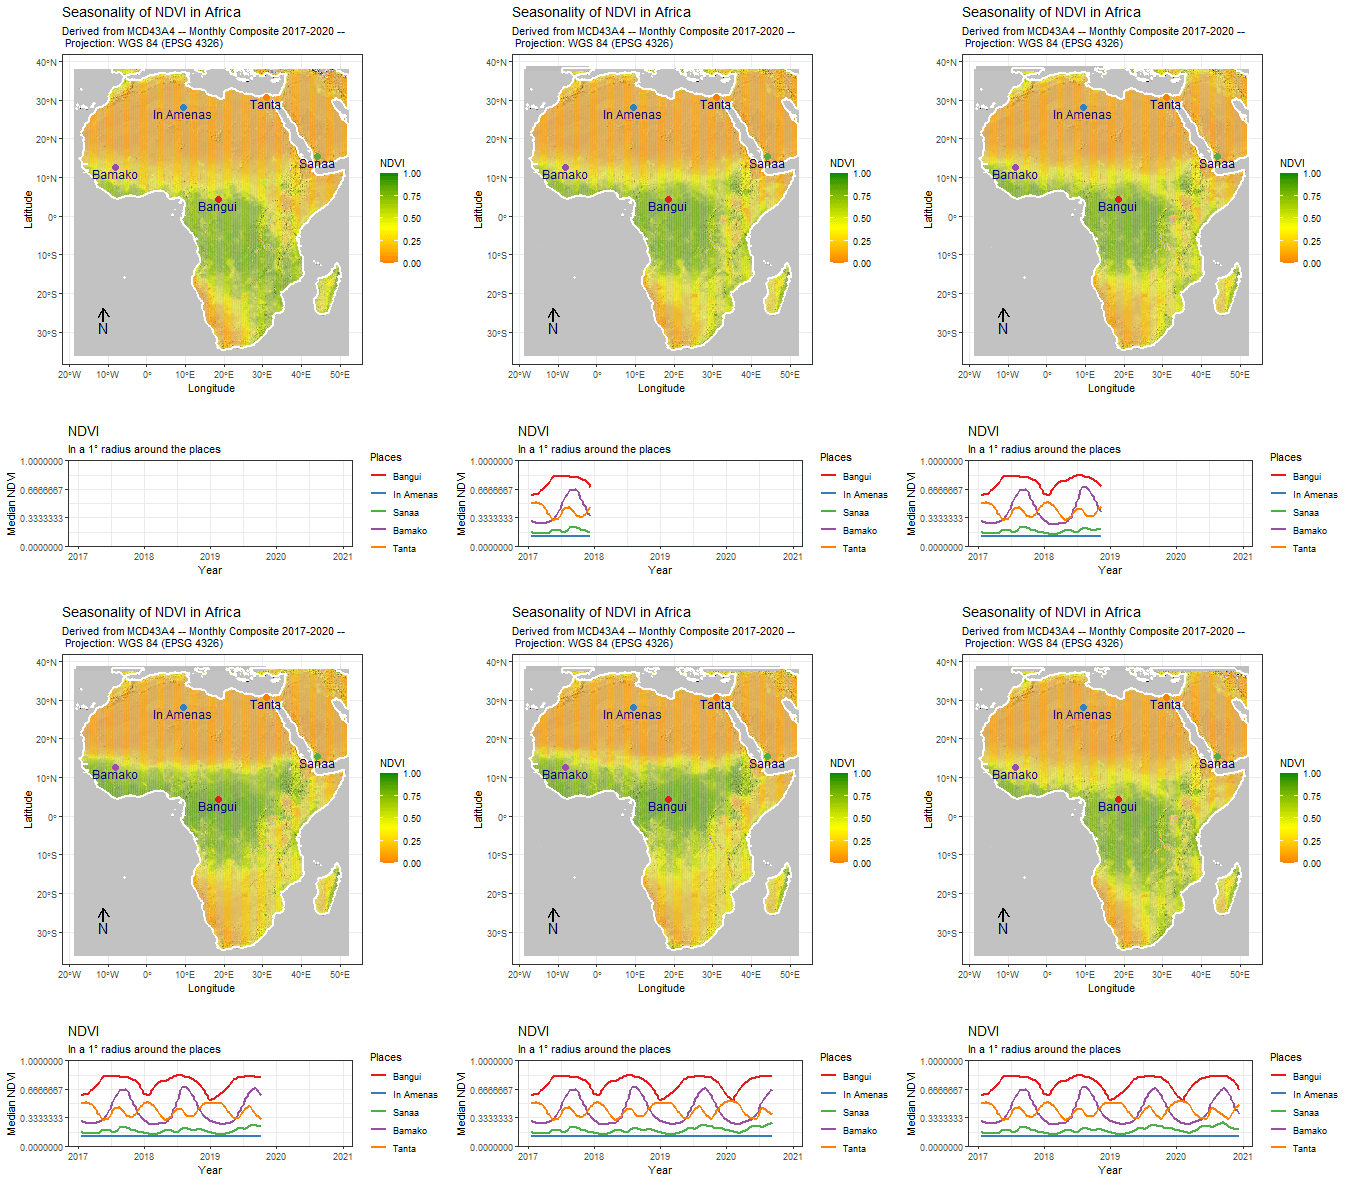
rtsVis can create animations of discrete, gradient, and multiband rasters (RGB). It connects nicely to the ImageFusion, moveVis, and rHarmonics packages which offer additional tools for raster time series.
The package allows for the creation of animated charts that go along with the animated rasters. A variety of plot types are available by default and user-made plot types are supported, so you can leverage the full power of ggplot.
For examples, and a guide on how to create custom plot functions, check out the Demo repository.
rtsVis is available on CRAN. The package is in development, with bugs getting fixed and features getting added. Get in touch if you want to contribute!
