scientific graphics course

scientific graphics course

m

July 3, 2024

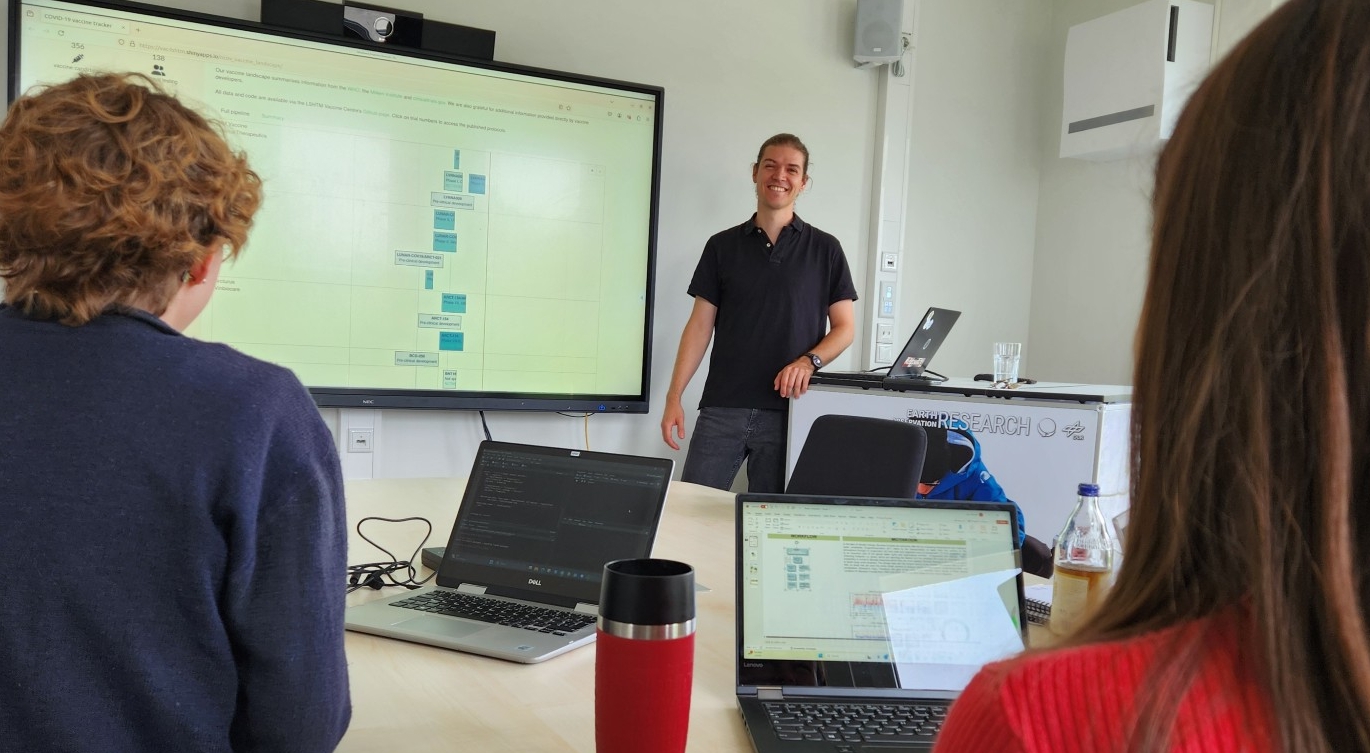
Beside the various remote sensing courses such as radar, cloud computing, terrain analysis, urban analysis etc. we do also offer courses on softskills such as scientific writing, presentations as well scientific graphics and maps.
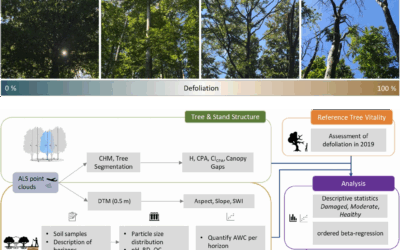
Within our scientific graphics course do we cover advanced methods in ggplot to create meaningful and good looking graphics, we introduce the students to tikz and pgf, the latex graphics engines and also interactive graphics and maps via shiny.
Always great to discuss with our students the potential and use case for such graphics and also critically evaluate existing graphics for their informative value and if the scientific findings are properly and visually appropriate displayed.

you may also like:

EOCap4Africa training in Ruhengeri

EOCap4Africa training in Ruhengeri

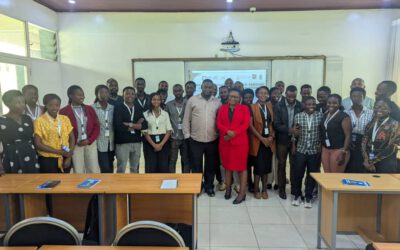
This week, over 25 students are attending a training session at the Institute of Applied Sciences (INES) in Ruhengeri, Rwanda, using the MSc module on Remote Sensing for Biodiversity Conservation that we developed. This module is part of the EOCap4Africa project...

Science Slam 10th anniversary with Hannes Taubenboeck

Science Slam 10th anniversary with Hannes Taubenboeck

This year, the popular Science Slam of the University of Würzburg is celebrating its tenth anniversary – a great reason to host not just one, but two exciting evenings: Friday, 7 November 2025, 7:00–9:00 p.m. – the regular competition Saturday, 8 November 2025,...