Researchers from the Geography Department of the Humboldt-University Berlin in Germany, the Institute of Epidemiology of the Helmholtz Zentrum München in Neuherberg, the Earth Observation Center (EOC) as well as the Institute of Atmospheric Physics of the German Aerospace Center (DLR) in Oberpfaffenhofen and our Earth Observation Research Cluster of the University of Würzburg teamed up for a study on technical variations in European road traffic noise exposure maps. The paper titled “Pixels, chisels and contours – technical variations in European road traffic noise exposure maps” was just published in the Journal of Environmental Management by Jeroen Staab, Ariane Droin, Matthias Weigand, Marco Dallavalle, Kathrin Wolf, Arthur Schady, Tobia Lakes, Michael Wurm and Hannes Taubenböck.
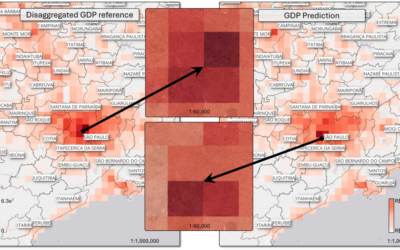
Here is the abstract of the paper: Motorized traffic often causes road noise directly in front of our homes and windows. Yet long-term exposure to noise impact life’s quality and can potentially cause negative effects on human health. Furthermore, social and behavioral effects have been measured. To protect people’s health and well-being from such noise, the European Noise Directive (END, 2002/49/EC) obliges countries to produce strategic noise maps every five years for large agglomerations and along major roads, which are then used for noise action planning. Besides that, the official noise maps are a valuable data source for environmental exposure analyses. However, the END has some limitations. The definition of urban agglomerations is vague, different input parameterizations lead to data inconsistencies across administrative units, undefined post processing methods introduce geometric artifacts, and topological errors incompliant to the common Simple Features Implementation Specification hinder working with the published geodata. The aim of this article is to provide practical insights for end-users and stipulate for concise regulations. Moreover, we highlight that these variations limit the comparability of maps in environmental impact assessments. We compile 84 separate noise assessments in Germany reported according to the END to review shape and structure of the geographic data. Graphical representations are used to show in particular how vertices are connected to polygons in noise contour maps and that these geometric alterations effect the eventual statistics on exposed population shares. We aggregate spatial metrics to assess the reported data’s spatial properties in an automatic manner, e.g. when receiving data in future mapping rounds. Along with our quality assessment, a nation-wide dataset on road traffic noise was produced. Depicting the yearly averaged noise level indicator Lden, which integrates exposure at day, evening and night, for 2017, it serves as common ground for environmental health analyses. The examination of different raster to polygon conversion implementations is fundamental to other geodata managers outside the domain of noise mapping, as well.
Here is the link to the full paper: https://www.sciencedirect.com/science/article/pii/S0301479725014513
This research is part of the work on the topic of noise and environmental impact. For further studies please see here:
- https://www.nature.com/articles/s41370-021-00355-z
- https://ieeexplore.ieee.org/document/10144160
- https://elib.dlr.de/187661/1/STAAB-etal-2022_Proceedings_A04.pdf
- https://www.researchgate.net/publication/365677566_Soundscapes_on_edge_-_The_real-time_machine_learning_approach_for_measuring_Soundscapes_on_resource-constrained_devices
- https://elib.dlr.de/135117/