Open-Source WebGIS for Monitoring the Water Use Efficiency in Central Asia
For sustainable water management in Central Asia, remote sensing products provide independent information on land use, crop productivity and water use efficiency, which is made accessible to local decisionmakers through an online map tool.
The target area consists of the agricultural irrigation areas of the Aral Sea basin (about 9 million ha in total) in southern Kazakhstan, Kyrgyzstan, Tajikistan, Turkmenistan, Uzbekistan and northern Afghanistan.
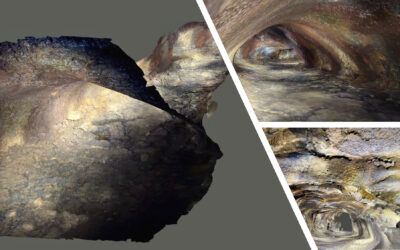
The interactive web map application “Water Use Efficiency Monitor in Central Asia” (WUEMoCA) is designed to improve the use of land and water resources in Central Asian irrigation systems in a sustainable way. The data are based on analysis results from freely accessible climate data and MODIS satellite imagery.
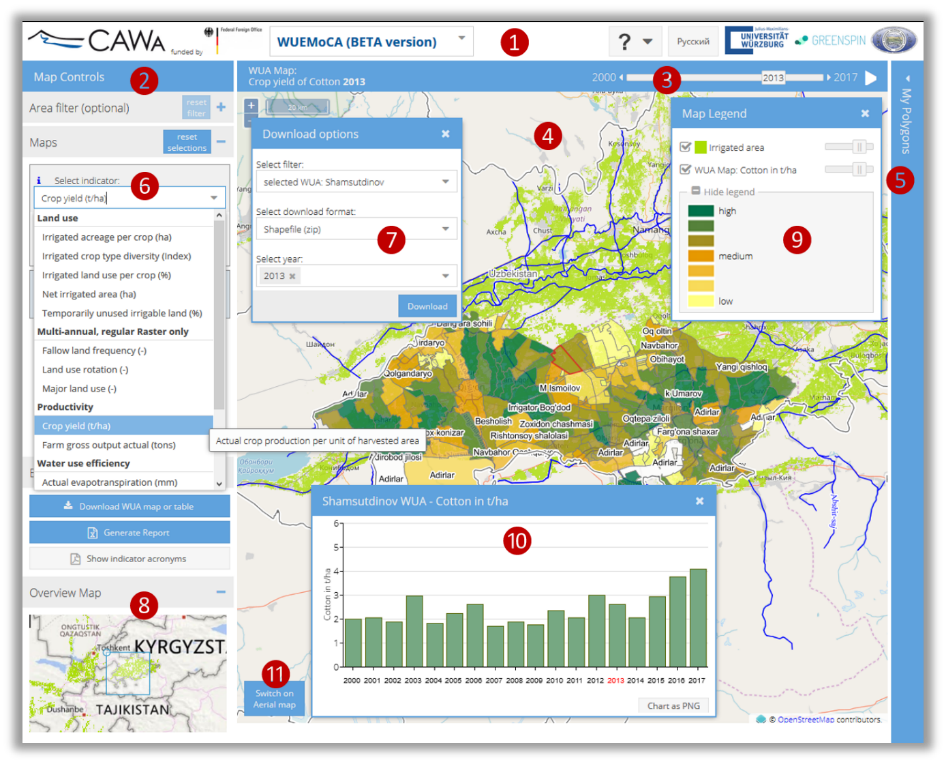
WUEMoCA main view
WUEMoCA main view with map filter (2), selection options (6), spatial (4) (9) and temporal (3) (10) exploration of various indicators (6), download (7) and overview (8) functions. Furthermore: general information in the Header (1), User polygon tool, here not activated (5), button to show Arial map (11).
The visualization concept allows for selection by users
- 15 indicators (e.g., land use intensity, crop yield, water availability)
- 10 crop types (e.g., cotton, wheat and rice)
- 7 aggregation levels (e.g., provinces, districts, hydrological units)
- 18 years (2000-2017).
Sober numbers are vividly presented in their spatial distribution (as maps) and temporal development (as diagrams).
User interactions for on-the-fly calculations are possible:
- draw or upload own aggregation polygons (e.g., water supply zones)
- insert or upload water intake values for a specific area
All results, also user-driven, are exportable for further analysis (e.g., as Shapefile or Excel table).
The applied research project CAWa is characterized by
- cooperative concept development (indicator definitions, functions, workflows, logic) together with the University of Wuerzburg, Germany and the Scientific Information Center Tashkent, Uzbekistan (SIC ICWC)
- integration of user requirements from the water management
- transfer of the system architecture and the know-how into the region
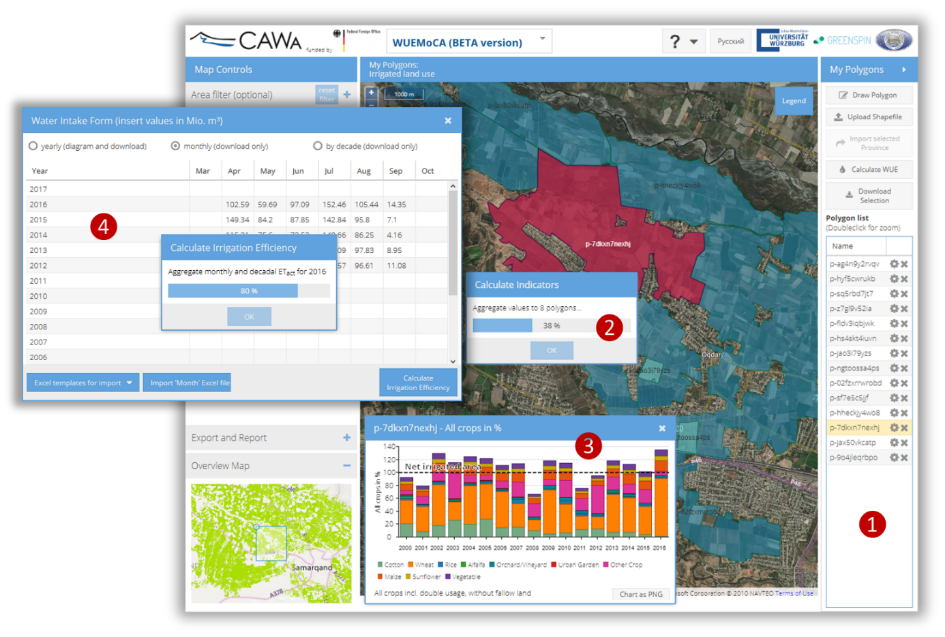
User polygon tool
WUEMoCA User polygon tool (1) (draw or upload polygons, calculate indicators on-the-fly (2), visualize (3) and export the results as Excel or Shapefile) with Water Use Efficiency calculation tool (water intake input form) (4)
Outlook: the new interactive Productivity calculation tool will be integrated soon.