
R package for time-series animation of rasters

R package for time-series animation of rasters

m

June 18, 2021

One of remote sensing’s greatest strengths is its capability to deliver consistent and highly resolved time series. These have a wonderful potential for visualizations and analysis.
Creating a fluid and pretty animation from a collection of tifs can be complicated, as it involves a number of steps:

  • Filling gaps in the raster
  • Creating consistent spatial plots
  • Enhancing and decorating the plots
  • Adding ancillary animated charts

Our new R package rtsVis simplifies and assists in all these processing steps. Using just a few functions, you can get from a list of input images to animation-ready ggplots.
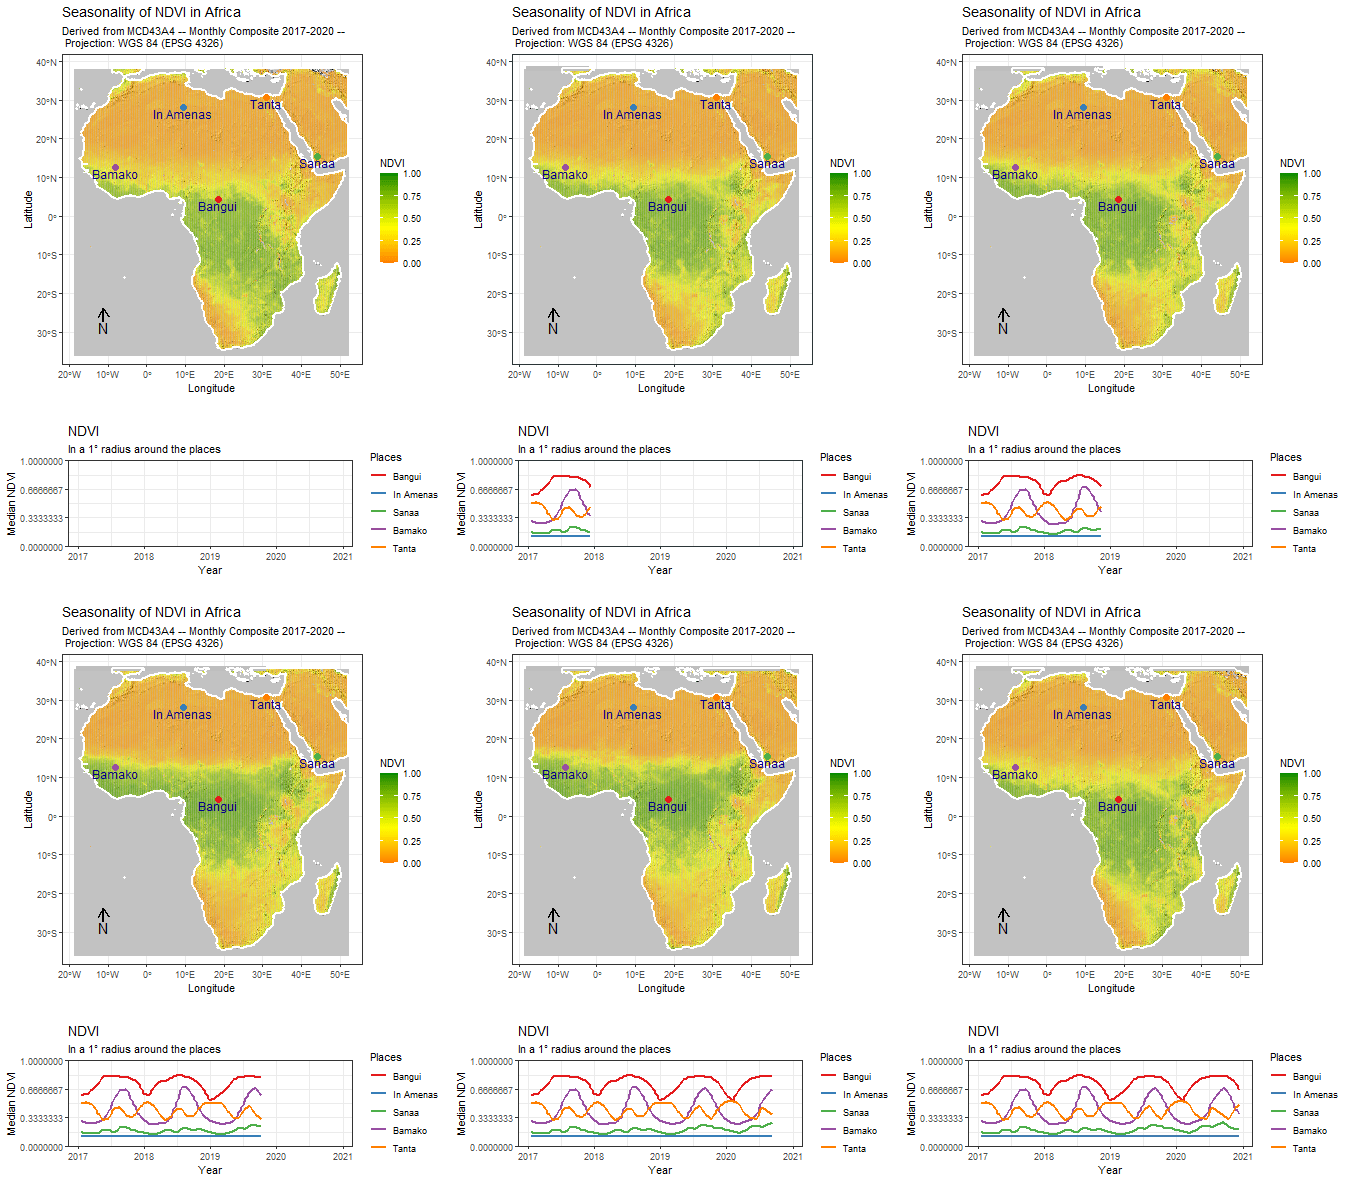
rtsVis can create animations of discrete, gradient, and multiband rasters (RGB). It connects nicely to the ImageFusion, moveVis, and rHarmonics packages which offer additional tools for raster time series.

The package allows for the creation of animated charts that go along with the animated rasters. A variety of plot types are available by default and user-made plot types are supported, so you can leverage the full power of ggplot.

For examples, and a guide on how to create custom plot functions, check out the Demo repository.

rtsVis is available on CRAN. The package is in development, with bugs getting fixed and features getting added. Get in touch if you want to contribute!

follow us and share it on:

you may also like:

In the News: Monid Habitrack Featured in Süddeutsche Zeitung

In the News: Monid Habitrack Featured in Süddeutsche Zeitung

Süddeutsche Zeitung recently covered our Monid Habitrack project, and we're happy to share it. The article follows the research team at work in the Oberpfalz, where our drones map vegetation and surface temperature while ticks are collected on the ground and tested...

We’re proud to be part of Space Days Würzburg 2026

We’re proud to be part of Space Days Würzburg 2026

We're happy that we are officially joining the Space Days Würzburg, from October 9th to 10th, 2026. The event brings together astronomy, informatics, and space science for two days, and we contribute Earth observation. Because studying space isn't just about looking...

A reply to the Programming Hero Syndrome post

A reply to the Programming Hero Syndrome post

A while back there was a post about the "Programming Hero Syndrome." This is a small extension to it, from a female perspective to provide a different view. When I started EAGLE, in those first weeks and months, I'd join internship talks or MSc defenses, listen to...

Getting Ready for 25 + 10

Getting Ready for 25 + 10

Next week's the big one. Twenty five years of EORC and ten years of EAGLE, all in one event, and we're expecting around 250 people through the door. Sabine Oppmann's been leading the prep meetings, and we've split things into clear teams: setup, catering, AV and...

Share This