Urbanization is one of the major drivers of global change. Statistically every single week an estimated 1.5 million people are added to cities worldwide.
Over the last 15 years, our team at the Earth Observation Center (EOC) of the German Aerospace Center (DLR) and our Earth Observation Research Cluster (EORC) in collaboration with many researchers across the globe has produced various scientific papers on different aspects of global urbanization using remote sensing and other geodata.
We take the publication of a paper on this subject yesterday (https://www.sciencedirect.com/science/article/pii/S0197397525001134 – we have reported on this: https://remote-sensing.org/new-publication-on-global-urbanization-from-1985-to-2015-and-its-efficiency-in-terms-of-land-consumption/)as an opportunity to briefly review some research studies on this subject:
In this most recent paper, we reveal that urban areas built between 1985 and 2015 are less dense in terms of built-up structures and population than the areas built before 1985. Urban expansion has thus become more inefficient with respect to the usage of space. Developed scenarios show the unutilized potential: If urban expansion would have been developed more densely, e.g. by more compact structures, 1.466 billion more people could live in the same newly built urban areas: https://www.sciencedirect.com/science/article/pii/S0197397525001134.
Nowhere in the world urban growth rates have been measured with higher dynamics than in Asia in general and in East Asia in particular: https://www.sciencedirect.com/science/article/pii/S0264275124003317. China’s megacities are among the fastest growing in the world: https://www.sciencedirect.com/science/article/pii/S0034425711003427. In a global ranking of city sizes, we were also able to show that administrative units obscure reality. Based on a data-driven comparable delineation of cities, we revealed the urban agglomeration in the Pearl River Delta as the largest city on our globe: https://www.sciencedirect.com/science/article/pii/S0034425719303724. Even larger are urban corridors – a concept for large, linear urban developments – where a global inventory was developed: https://www.mdpi.com/2220-9964/5/12/233. And, apart from the big cities, we have also analyzed settlement and population developments along all border regions worldwide: https://www.sciencedirect.com/science/article/pii/S0143622822002375.
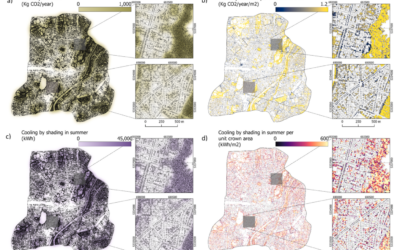
In addition to the dichotomous classifications into settlements vs. non-settlements – used in the studies introduced above –, we also classified and analyzed the intra-urban variability of built structures. Based on multisensory Earth observation data and deep learning, we were able to produce a detailed morphologic classification of urban agglomerations across the globe: https://www.sciencedirect.com/science/article/pii/S0034425721005149. One study based on this data set revealed that seven city types reflect the structural configuration of cities across the globe and that some are largely congruent with geographical regions such as Europe: https://www.sciencedirect.com/science/article/pii/S0264275120301347. We were also able to show that the built landscape encodes information about the planned nature of the structures: https://www.sciencedirect.com/science/article/pii/S0169204623000300. We also showed how variable intra-urban land consumption is across the globe: https://www.sciencedirect.com/science/article/pii/S0264275121000615.
Beyond those global works, more specific works on regions (e.g. China – see here: https://www.linkedin.com/feed/update/urn:li:activity:7280894594198695936/) or structural types (e.g. slums – see here: https://www.linkedin.com/feed/update/urn:li:activity:7237099844408852480/) have been carried out
We thank all colleagues for the inspiring collaborations over the years.