
R Package for harmonic modelling of time-series data

R Package for harmonic modelling of time-series data

April 23, 2020

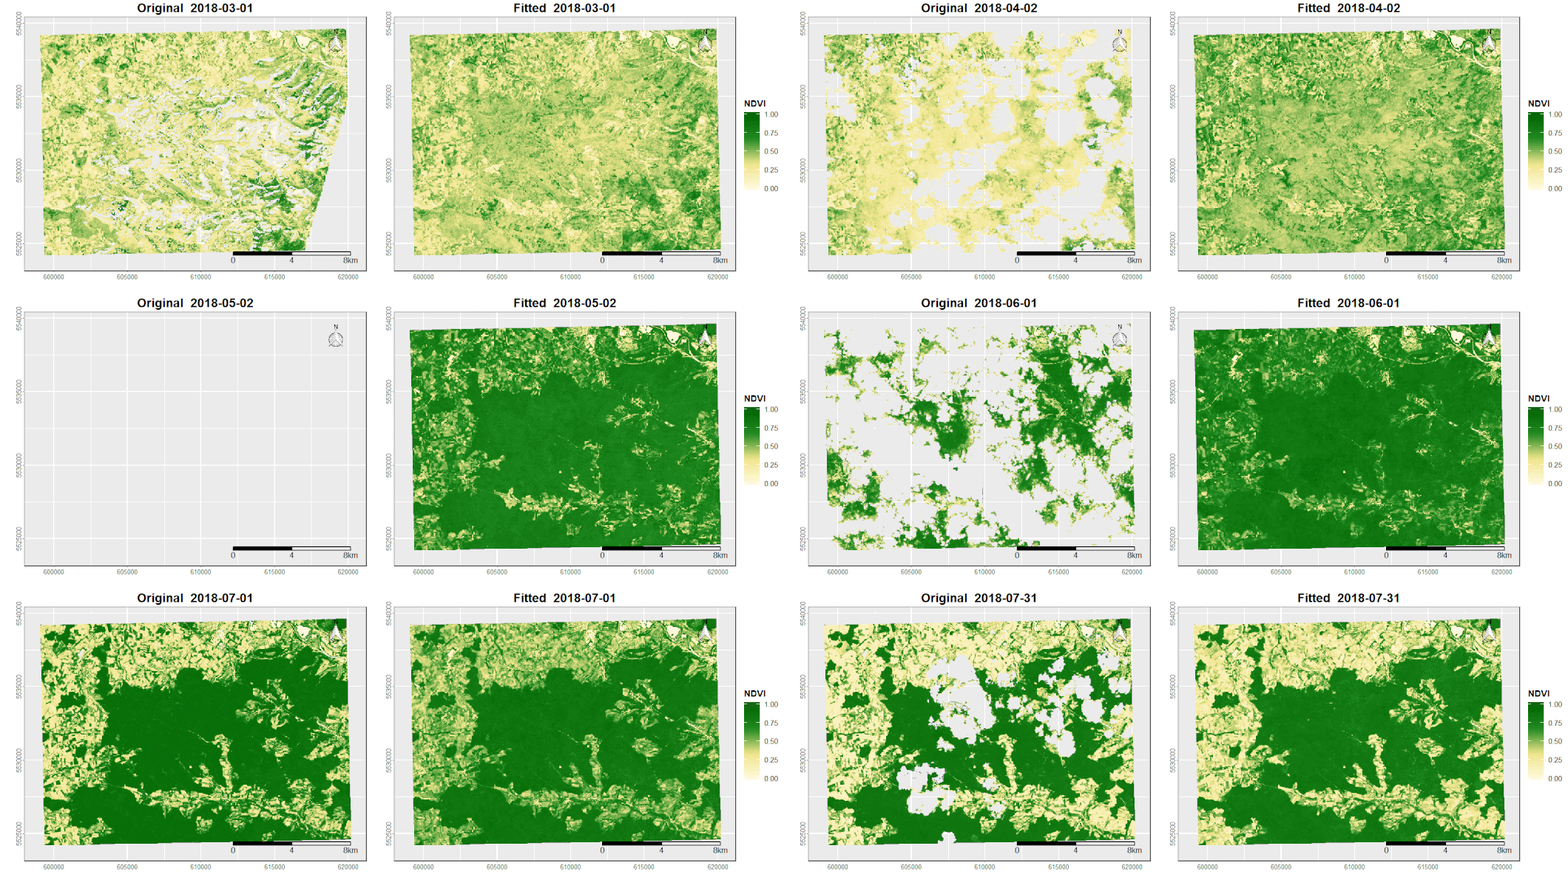
Sentinel-2 NDVI time-series over the Steigerwald. Left: Original satellite scenes after cloud, cloud shadow and snow maksing. Right: Interpolated time-series using a harmonic modelling.

In order to fully exploit the monitoring potential of the satellite systems, challenges such as noise and data gaps must be effectively addressed. These quality losses are mainly caused by sensor artifacts, clouds, cloud shadows and other weather conditions (Verbesselt et al., 2012). In the context of time series analysis, harmonic modeling is a powerful tool to fill these gaps and reduce noise by smoothing the original signal (de Jong et al., 2011).

For that purpose, I created an R-package rHarmonics which enables the user to perform a harmonic analysis on a given time-series data set.

To calculate the harmonic fitted curve of a periodic signal, ordinary least squares regressions are computed using coupled sine and cosine curves on time-series data. The underlying algorithm which is based on Shumway & Stoffer (2017) equations 4.1 – 4.2 can be seen below:

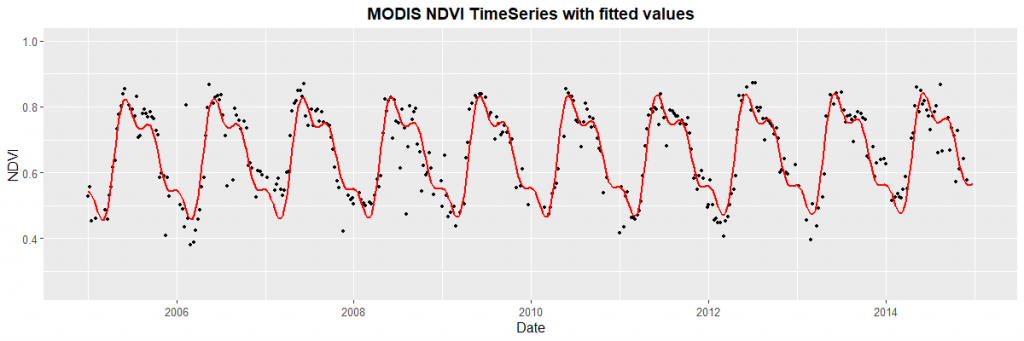
MODIS NDVI time-series data together with a harmonic fitted curve using 3 cylces per year.


Literature:

de Jong, R., de Bruin, S., de Wit, A., Schaepman, M. E., & Dent, D. L. (2011). Analysis of monotonic greening and browning trends from global ndvi time-series. Remote Sensing of Environment, 115 (2), 692–702.

Shumway, R. H., & Stoffer, D. S. (2017). Time series analysis and its applications: with r examples. Springer.

Verbesselt, J., Zeileis, A., & Herold, M. (2012). Near real-time disturbance detection using satellite image time series. Remote Sensing of Environment, 123 , 98–108.

follow us and share it on:

you may also like:

Teaching activities in the Arctic: EORC at UNIS on Svalbard

Teaching activities in the Arctic: EORC at UNIS on Svalbard

It started a few years ago, when Mirjana Bevanda built up a collaboration with partners at UNIS, the University Centre in Svalbard. Jakob Schwalb-Willmann joined soon after, and today a growing group from EORC heads north to teach there, including Antonio...

A First Get-Together with the New EAGLE Generation 🦅

A First Get-Together with the New EAGLE Generation 🦅

A new EAGLE generation means new faces, new ideas, and the start of another journey in Earth Observation. And what better way to kick things off than with a relaxed evening at the pub? Our first social event brought together the new students, older EAGLE generations,...

An Evening with Professor Jarugu Narasimha Moorthy

An Evening with Professor Jarugu Narasimha Moorthy

It was a pleasure to have dinner with Professor Jarugu Narasimha Moorthy, who received an honorary doctorate from the Faculty of Chemistry and Pharmacy in recognition of his achievements. The ceremony took place on 29 September 2026 in the Chemistry Central Building....

Ecology or Sampling Bias? A Roadside Perspective on Invasion Risk

Ecology or Sampling Bias? A Roadside Perspective on Invasion Risk

At the 2026 annual meeting of the AK Fernerkundung (German Working Group on Remote Sensing), which was hosted by the Thünen Institute in Braunschweig, our EORC team member Dr. Insa Otte presented research results on sampling bias in species distribution models in...

bzgl. Art. 50 Verordnung (EU) 2024/1689 (AI Act):

Überwiegend werden eigene originäre Texte und Bilder des EORC genutzt, jedoch sind einige Inhalte von blog post Texten teilweise mit Hilfe von KI überarbeitet worden und einige Bilder sind ganz mit KI erstellt, die jedoch deutlich keine photorealistische Darstellungen abbilden. Aussnahmen sind KI generierte fernerkundliche Datensätze, die explizit für Forschungszwecke mit KI erstellt wurden, hier wird aber durch den assoziierten Text der wissenschaftliche Grund der KI generierten Bilder erläutert.

Share This