
Annika Rudolph a BSc student handed in her BSc thesis on species distribution modeling in Kenya using remote sensing data and the randomForest model. It is impressive what she achieved within 8 weeks without any prior R knowledge. All remote sensing data as well as statistical modeling were done in R, a lot of effort has also been put into the acquisition of relevant remote sensing imagery 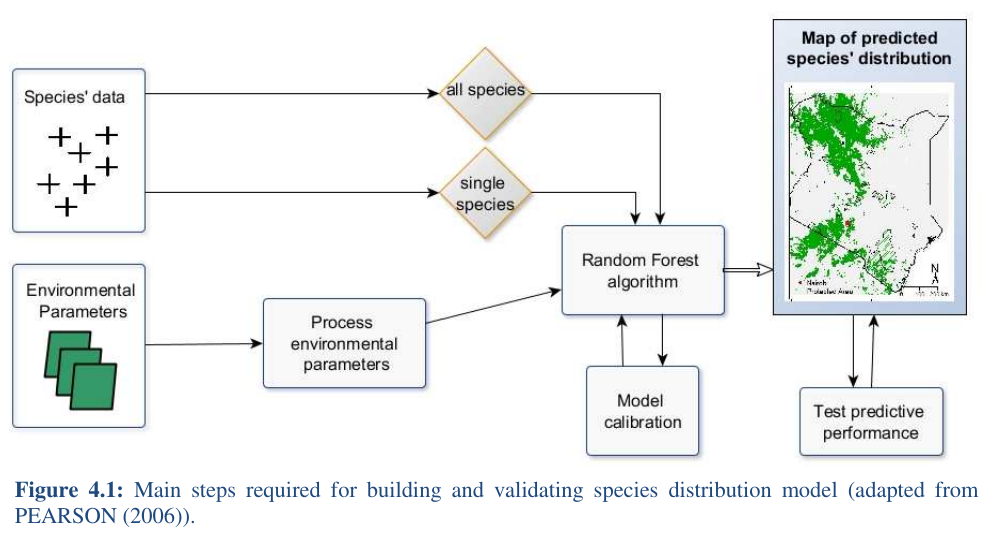 .
.
In the passed decades global environmental changes such as climate and land-use changes and anthropogenic pressure increased. As a result the world’s biological diversity faces exceptional threat with following increasing rate of biodiversity loss. It becomes important to assess and
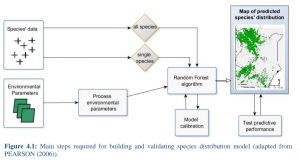
monitor actual or potential geographic distribution of species to prevent this ongoing loss. This has become an important component of conservation planning in recent years. A wide variety of modeling techniques have been developed for this purpose, such as remote sensing methods. These models ordinarily utilize associations between environmental variables and known species occurrence records to identify environmental conditions within which populations can be maintained. The spatial distribution of environments that are suitable for the species can then be estimated across a study region. In this study species distribution is estimated in Kenya using environmental variables derived
from remotely sensed data such as Moderate Resolution Imaging Spectroradiometer (MODIS). The focus of this work lies on the comparison between two approaches in terms of their appropriateness for predicting species distribution within the study area. The first approach
analyzes the species probability from statistics of all summed up species. The second approach examines species probability for each species and sums up statistics afterward. The results provide an overview of the predicted species probability in regard to their vicinity to Protected Areas.
For each approach the Pearson’s coefficient of correlation between observations and predictions (r2) and Receiver Operating Characteristics (ROC) is calculated. The results of the Random Forest algorithm reach a r2 of 0.49 for the first approach and 0.11 for the second approach. ROC is 0.88 for the first approach and 0.67 for the second approach. These results exhibit reasonable significance. This study showed that the predicted probability of species distribution is close to the actual probability for the first approach. The second approach is far from the actual probability.