
DATA VISUALIZATION for CLEAR COMMUNICATION

DATA VISUALIZATION for CLEAR COMMUNICATION

m

November 8, 2019

How to communicate with decision-makers? What is the best way to disseminate knowledge and results? What are the principles of a clear and trustworthy visualization of data?

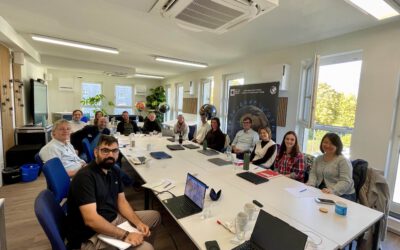
These questions were pursued at the one-day conceptual seminar “Visualizing Science Compact”, provided by the National Institute for Science Communication (www.nawik.de) and hosted by the STATE Studio in Berlin.

Using the example of infographics, useful guidelines and tools for well-designed presentations, and trends in visualization to communicating clearly, precisely, and efficiently were not only discussed, but also directly applied. Staff at the Department of Remote Sensing will benefit from the knowledge gathered to support science-based decision-making by developing and disseminating policy briefs in the project WASCAL-DE-Coop.

follow us and share it on:

you may also like:

EORC at City Festival

EORC at City Festival

The Stadtfest Würzburg took over the city this weekend, and any many organisations, local initiatives, like DLRG and all other kinds of groups had booths, and we joined in with our own little corner on Earth observation beside various other University tents by...

bzgl. Art. 50 Verordnung (EU) 2024/1689 (AI Act):

Überwiegend werden eigene originäre Texte und Bilder des EORC genutzt, jedoch sind einige Inhalte von blog post Texten teilweise mit Hilfe von KI überarbeitet worden und einige Bilder sind ganz mit KI erstellt, die jedoch deutlich keine photorealistische Darstellungen abbilden. Aussnahmen sind KI generierte fernerkundliche Datensätze, die explizit für Forschungszwecke mit KI erstellt wurden, hier wird aber durch den assoziierten Text der wissenschaftliche Grund der KI generierten Bilder erläutert.

Share This