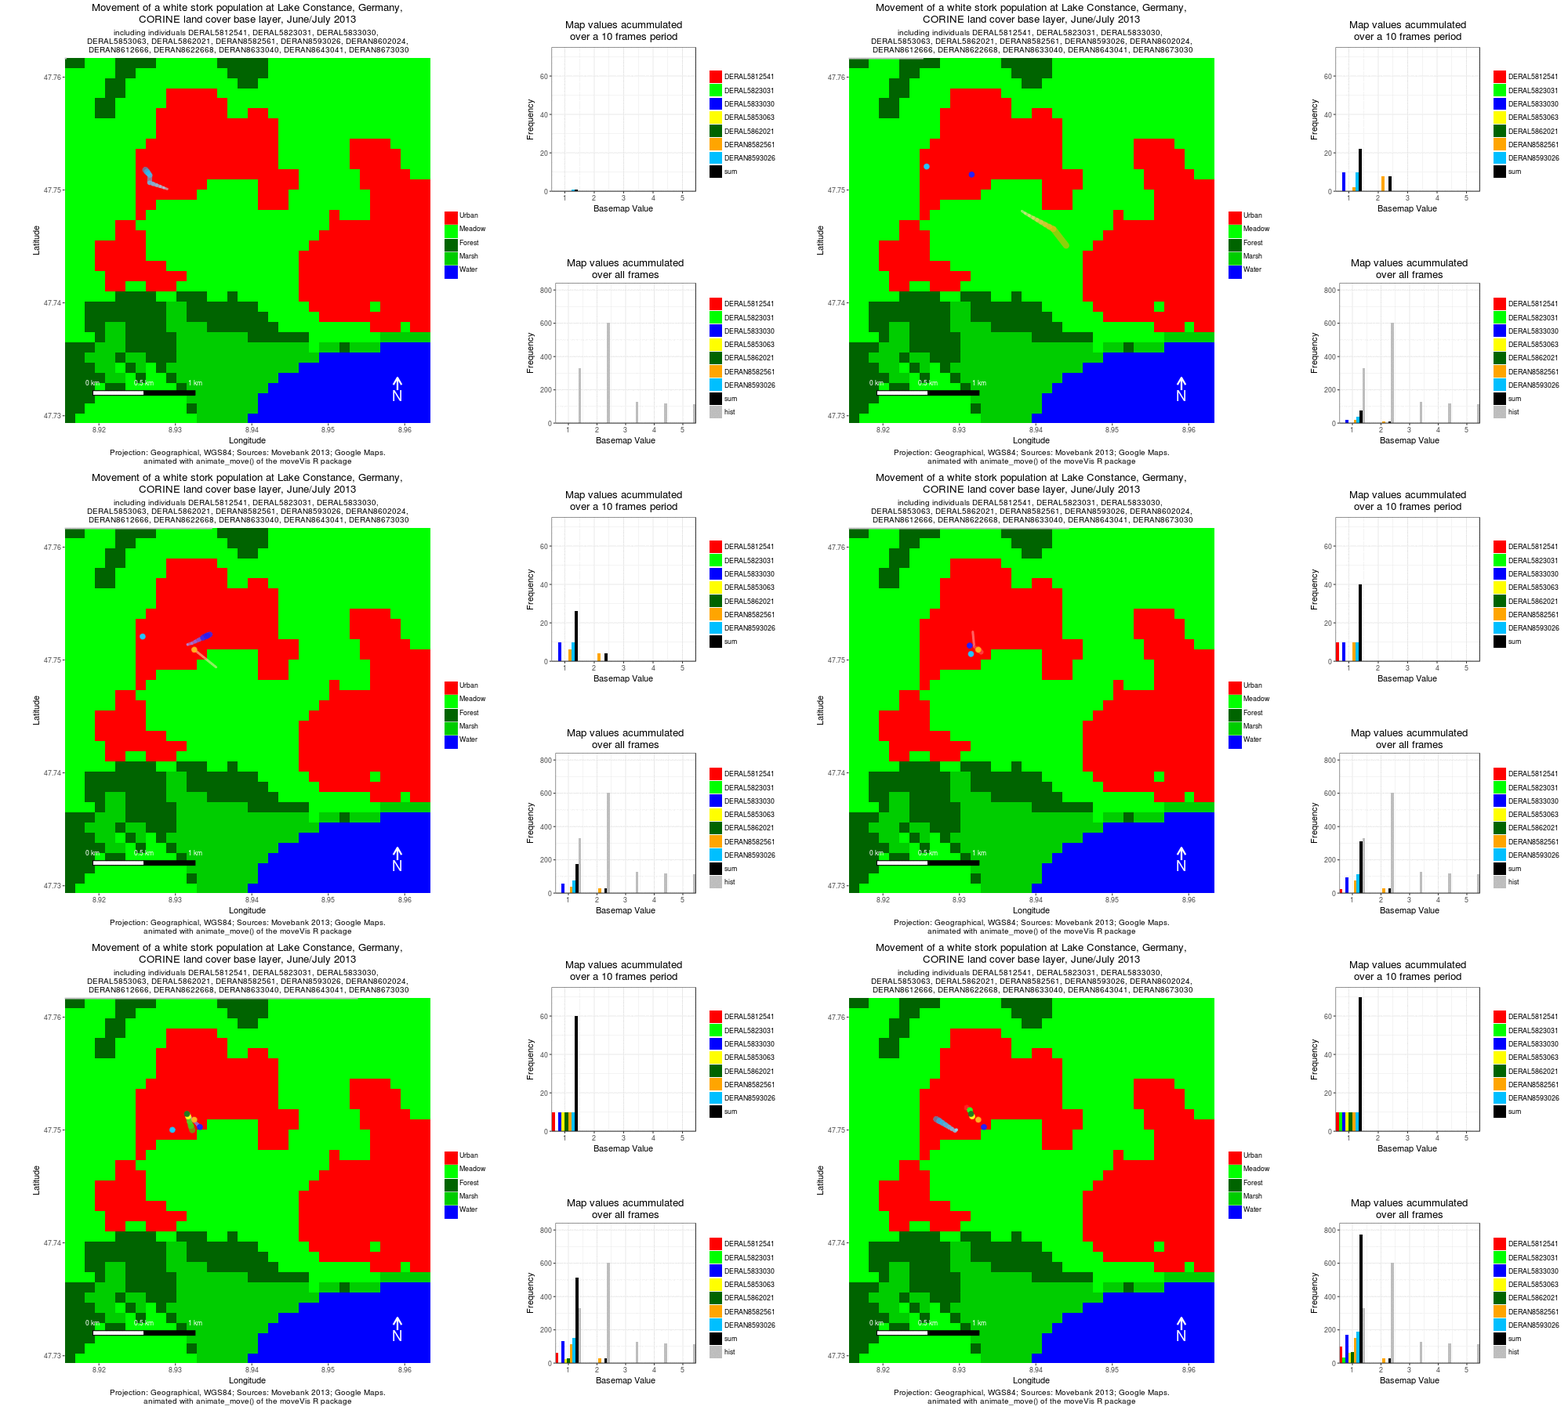
Our EAGLE M.Sc. student Jakob Schwalb-Willmann developed the moveVis package and is now available via CRAN. Beside the animation of movement also the corresponding environmental values can be shown for the whole extent, as cumulative values per individual or across the whole group or just the average value of the last n steps to highlight changes in species-environment relationships. All graphical parameters can be changed by the user via ggplot commands for the map and the statistics graphs. MoveVis will also be covered in the next AniMove course.
Please report any issues to the bug manager at www.movevis.org or post your questions to the AniMove mailing list.
Please also send us (via mail, twitter or FB) your best moveVis animations and we are happy to create a gallery of animations. Please also provide information how to reference the animation (your name, affiliation, email).
This initiative is part of the Opt4Environment project and was funded by the German Aerospace Center (DLR) on behalf of the Federal Ministry for Economic Affairs and Energy (BMWi) with the research grant 50 EE 1403. The movement data we used was provided by the Max Planck institute for Ornithology (MPIo). Click below to reach the involved parties.

