scientific graphics course

scientific graphics course

m

July 3, 2024

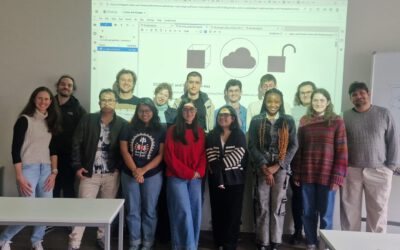
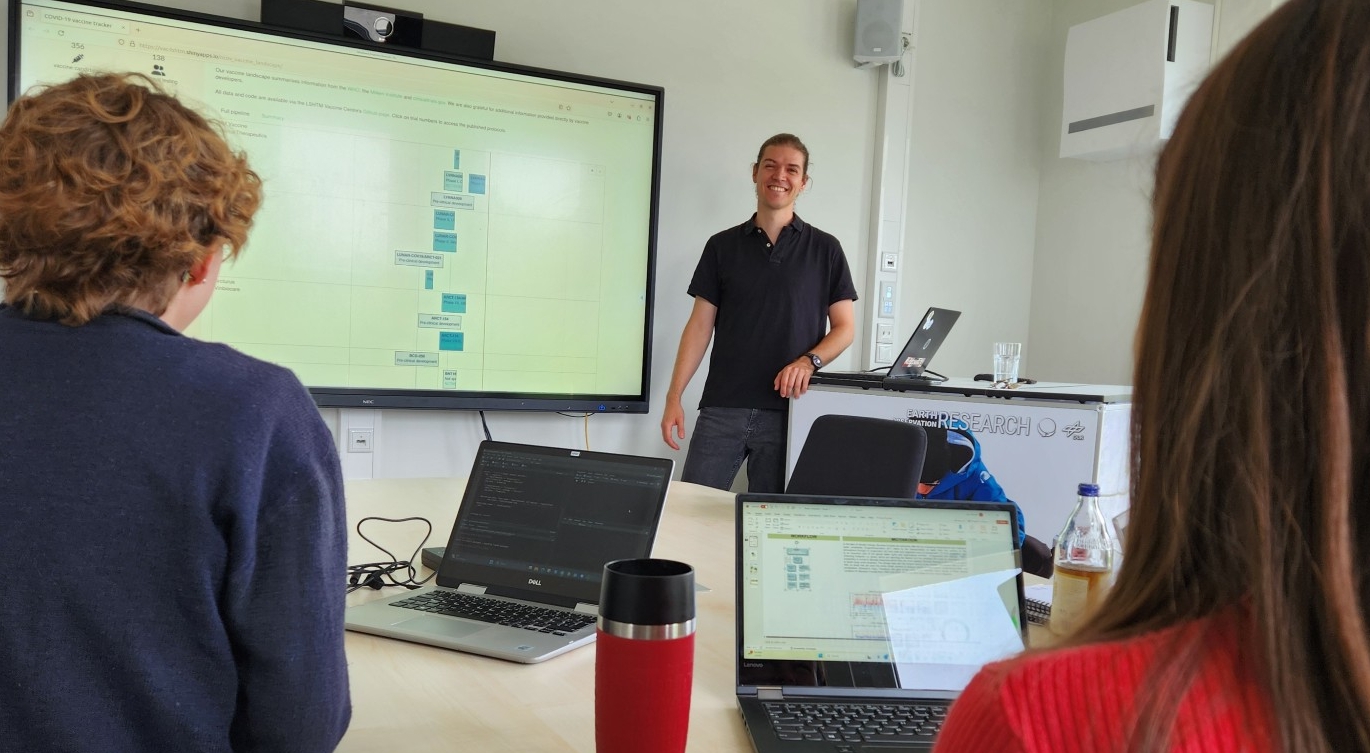
Beside the various remote sensing courses such as radar, cloud computing, terrain analysis, urban analysis etc. we do also offer courses on softskills such as scientific writing, presentations as well scientific graphics and maps.
Within our scientific graphics course do we cover advanced methods in ggplot to create meaningful and good looking graphics, we introduce the students to tikz and pgf, the latex graphics engines and also interactive graphics and maps via shiny.
Always great to discuss with our students the potential and use case for such graphics and also critically evaluate existing graphics for their informative value and if the scientific findings are properly and visually appropriate displayed.

you may also like:

Successful MSc defense by Sonja Maas

Successful MSc defense by Sonja Maas

Big congratulations to Sonja Maas, who successfully defended her Master thesis today on the highly relevant and increasingly pressing topic: LiDAR-Based Acquisition Strategies for Forest Management Planning in a Mature Beech Stand Supervised by Dr. Julian Fäth and...

Visit at the Institute for Geoinformatics (IFGI) at University of Münster

Visit at the Institute for Geoinformatics (IFGI) at University of Münster

Two days ago, our PostDoc Dr. Jakob Schwalb-Willmann visited the Institute for Geoinformatics at University of Münster to give a talk at IFGI’s GI Forum titled “Can animals be used to classify land use? Employing movement-tracked animals as environmental informants using deep learning”.