
Mapping an active fire with various drones flying in parallel is hard enough. But getting the data processed, evaluated and turned into research datasets is a different story. The publication is on its way, and for now we’d like to share a dashboard by Antonio José Castañeda-Gómez that shows what this kind of data looks like in practice.
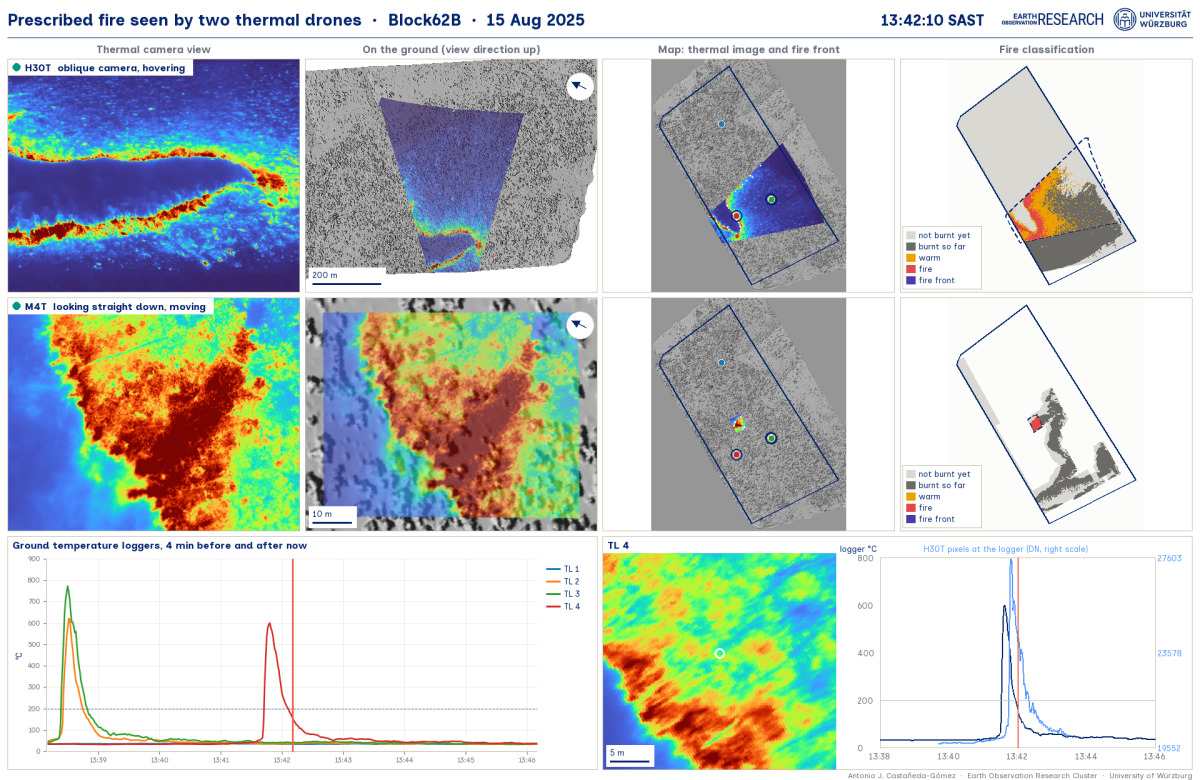
Each capture in the dashboard freezes one moment of a burn. The two rows are the two drones: the top one is an oblique camera, hovering; the bottom one is a camera looking straight down, moving.
The four columns walk through the processing chain. First, the thermal image as recorded. Second, the same image projected onto the ground. Third, a map of the thermal image together with the fire front. Fourth, the fire classification.
Below that, you’ll find the ground temperature loggers, plus a close-up of the image at the logger the fire is just reaching. That’s the part we like best, because it ties the aerial view directly to a measurement on the ground.
The whole analysis was done within our DFG Fire and Drought project in Kruger National Park, together with Antonio’s EAGLE MSc student Anna Bischof, and with the help of PhD candidate Luisa Pflumm and Dr. Mirjana Bevanda.
Stay tuned for the paper – we will post it on this news blog soon.
Each capture in the dashboard freezes one moment of a burn. The two rows are the two drones: the top one is an oblique camera, hovering; the bottom one is a camera looking straight down, moving.
The four columns walk through the processing chain. First, the thermal image as recorded. Second, the same image projected onto the ground. Third, a map of the thermal image together with the fire front. Fourth, the fire classification.
Below that, you’ll find the ground temperature loggers, plus a close-up of the image at the logger the fire is just reaching. That’s the part we like best, because it ties the aerial view directly to a measurement on the ground.
The whole analysis was done within our DFG Fire and Drought project in Kruger National Park, together with Antonio’s EAGLE MSc student Anna Bischof, and with the help of PhD candidate Luisa Pflumm and Dr. Mirjana Bevanda.
Stay tuned for the paper – we will post it on this news blog soon.